
Page 68 - Simplicity is Key in CRT
P. 68
ESC 2006
ESC 2009
ESC 2013
AHA
Strauss
ESC 2006
-
83 (42)
85 (43)
66 (33)
102 (51)
ESC 2009
-
151 (76)
93 (47)
144 (73)
ESC 2013
-
93 (47)
149 (75)
AHA
-
91 (46)
Strauss
-
68
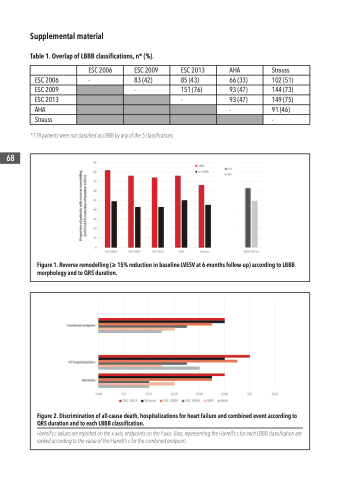
Figure 1. Reverse remodelling (≥ 15% reduction in baseline LVESV at 6-months follow-up) according to LBBB morphology and to QRS duration.
Figure 2. Discrimination of all-cause death, hospitalizations for heart failure and combined event according to QRS duration and to each LBBB classification.
Harrell’s c values are reported on the x-axis, endpoints on the Y-axis. Bars, representing the Harrell’s c for each LBBB classification are ranked according to the value of the Harrell’s c for the combined endpoint.
Supplemental material
Table 1. Overlap of LBBB classifications, n* (%).
*118 patients were not classified as LBBB by any of the 5 classifications.
