
Page 7 - HC Trends Report 2020
P. 7
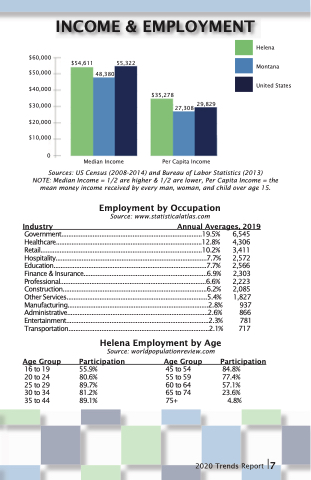
   $60,000 $50,000 $40,000 $30,000 $20,000 $10,000
0
$54,611
48,380
55,322
Helena Montana United States
  Median Income
$35,278
27,308 29,829
Per Capita Income
Sources: US Census (2008-2014) and Bureau of Labor Statistics (2013) NOTE: Median Income = 1/2 are higher & 1/2 are lower, Per Capita Income = the mean money income received by every man, woman, and child over age 15.
Employment by Occupation
Source: www.statisticalatlas.com
Industry Annual Averages, 2019
 Government.................................................................................19.5% Healthcare....................................................................................12.8% Retail.............................................................................................10.2% Hospitality.......................................................................................7.7% Education........................................................................................7.7% Finance & Insurance.......................................................................6.9% Professional....................................................................................6.6% Construction...................................................................................6.2% Other Services.................................................................................5.4% Manufacturing.................................................................................2.8% Administrative.................................................................................2.6% Entertainment..................................................................................2.3% Transportation.................................................................................2.1%
6,545 4,306 3,411 2,572 2,566 2,303 2,223 2,085 1,827
937 866 781 717
Age Group
16to19 20to24 25to29 30to34 35to44
Helena Employment by Age
Source: worldpopulationreview.com
Participation Age Group
55.9% 45 to 54
80.6% 55 to 59
89.7% 60 to 64
81.2% 65 to 74
89.1% 75+ 4.8%
Participation
 84.8% 77.4% 57.1% 23.6%
2020 Trends Report   7
INCOME & EMPLOYMENT
