
Page 125 - Zero Net Energy Case Study Buildings-Volume 1
P. 125
CLASSROOM & OFFICE BUILDING
CASE STUDY NO. 6
80
70
60
50
40
30
20
10
0
UC/CSU Benchmark (Post-1999 Existing UC/CSU Lab Buildings)
Energy Budget (80% of Benchmark)
Energy Modeling Result
Measured Annual Energy Use (2008)
Measured Annual Energy Use (2009)
Measured Annual Energy Use (2010)
UC Merced Classroom & Office Building Total Annual Energy Use
Axis Title
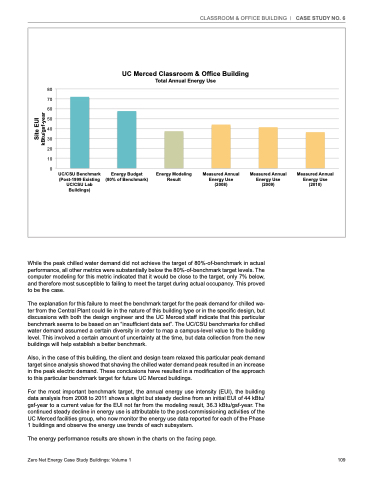
While the peak chilled water demand did not achieve the target of 80%-of-benchmark in actual performance, all other metrics were substantially below the 80%-of-benchmark target levels. The computer modeling for this metric indicated that it would be close to the target, only 7% below, and therefore most susceptible to failing to meet the target during actual occupancy. This proved to be the case.
The explanation for this failure to meet the benchmark target for the peak demand for chilled wa- ter from the Central Plant could lie in the nature of this building type or in the specific design, but discussions with both the design engineer and the UC Merced staff indicate that this particular benchmark seems to be based on an “insufficient data set”. The UC/CSU benchmarks for chilled water demand assumed a certain diversity in order to map a campus-level value to the building level. This involved a certain amount of uncertainty at the time, but data collection from the new buildings will help establish a better benchmark.
Also, in the case of this building, the client and design team relaxed this particular peak demand target since analysis showed that shaving the chilled water demand peak resulted in an increase in the peak electric demand. These conclusions have resulted in a modification of the approach to this particular benchmark target for future UC Merced buildings.
For the most important benchmark target, the annual energy use intensity (EUI), the building data analysis from 2008 to 2011 shows a slight but steady decline from an initial EUI of 44 kBtu/ gsf-year to a current value for the EUI not far from the modeling result, 36.3 kBtu/gsf-year. The continued steady decline in energy use is attributable to the post-commissioning activities of the UC Merced facilities group, who now monitor the energy use data reported for each of the Phase 1 buildings and observe the energy use trends of each subsystem.
The energy performance results are shown in the charts on the facing page. Zero Net Energy Case Study Buildings: Volume 1
109
Site EUI kBtu/gsf-year
