
Page 36 - Zero Net Energy Case Study Buildings-Volume 1
P. 36
CASE STUDY NO. 1
PACKARD FOUNDATION HEADQUARTERS BUILDING
Energy Use – Actual Measurement and Comparison to Modeling Results
The Tiger Team and the full-time building engineer have aggressively pursued a thorough post- occupancy commissioning process and promoted staff engagement in the goal of maintaining a ZNE performance through the early years of occupancy. Daily monitoring and trouble-shooting have kept the building on track to achieve this goal. The lobby dashboard display, available also on individual desktop monitors, is watched carefully for any trending away from the ZNE track.
The metered data for energy use through the entire year of 2012 shows that the building’s perfor- mance is very close to the modeling prediction overall. It’s interesting to note, however, that the heating energy use was higher than modeled, while the cooling energy consumption was less. The design engineers report that this is a pattern that is observed on other low-energy buildings as well—heating energy consumption is often underestimated by the modeling programs. It is thought that this is due the general effects of thermal bridging and assuming that the envelope can be built within a small tolerance, especially with regard to building tightness. Gaps in insula- tion installation and failure to seal points of air leakage during construction likely lead to higher actual heating loads than calculated in the ideal models.
On the other hand, the lower cooling energy may be partly due to an initial assumption that de- humidification would be needed to ensure that condensation does not occur on the active chilled beams. The attentiveness of the building occupants to natural ventilation and other interventions that reduce cooling demand may also have been a factor.
Energy Production versus Energy Use — Zero Net Energy Performance
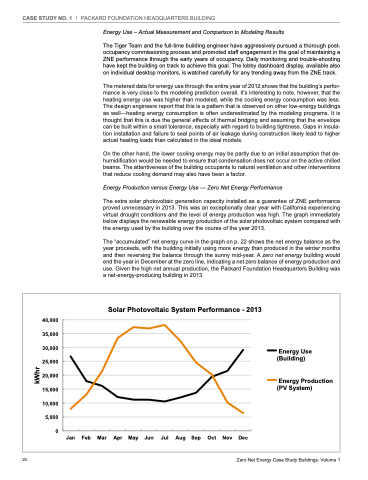
The extra solar photovoltaic generation capacity installed as a guarantee of ZNE performance proved unnecessary in 2013. This was an exceptionally clear year with California experiencing virtual drought conditions and the level of energy production was high. The graph immediately below displays the renewable energy production of the solar photovoltaic system compared with the energy used by the building over the course of the year 2013.
The “accumulated” net energy curve in the graph on p. 22 shows the net energy balance as the year proceeds, with the building initially using more energy than produced in the winter months and then reversing the balance through the sunny mid-year. A zero net energy building would end the year in December at the zero line, indicating a net zero balance of energy production and use. Given the high net annual production, the Packard Foundation Headquarters Building was a net-energy-producing building in 2013.
Packard Foundation Headquarters Building
40,000 35,000 30,000 25,000 20,000 15,000 10,000
5,000
Energy Use (Building)
Energy Production (PV System)
Solar Photovoltaic System Performance - 2013
0
Jan Feb Mar Apr May Jun Jul Aug Sep Oct Nov Dec
20
Zero Net Energy Case Study Buildings: Volume 1
kWhr
