
Page 59 - Zero Net Energy Case Study Buildings-Volume 2
P. 59
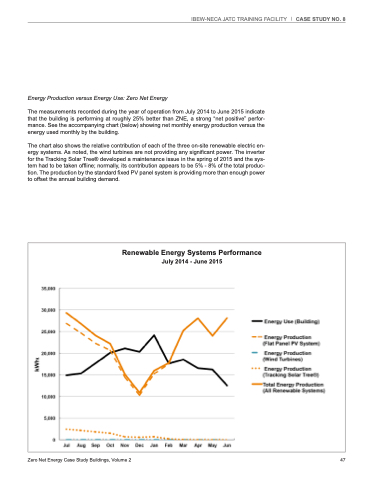
Energy Production versus Energy Use: Zero Net Energy
The measurements recorded during the year of operation from July 2014 to June 2015 indicate that the building is performing at roughly 25% better than ZNE, a strong “net positive” perfor- mance. See the accompanying chart (below) showing net monthly energy production versus the energy used monthly by the building.
The chart also shows the relative contribution of each of the three on-site renewable electric en- ergy systems. As noted, the wind turbines are not providing any significant power. The inverter for the Tracking Solar Tree® developed a maintenance issue in the spring of 2015 and the sys- tem had to be taken offline; normally, its contribution appears to be 5% - 8% of the total produc- tion. The production by the standard fixed PV panel system is providing more than enough power to offset the annual building demand.
IBEW-NECA JATC TRAINING FACILITY
CASE STUDY NO. 8
  Renewable Energy Systems Performance July 2014 - June 2015
 Zero Net Energy Case Study Buildings, Volume 2
47
