
Page 76 - Anuario Abrasca 19_20
P. 76
Acumulado do subsetor / Subsector accumulated
Investimentos Investments
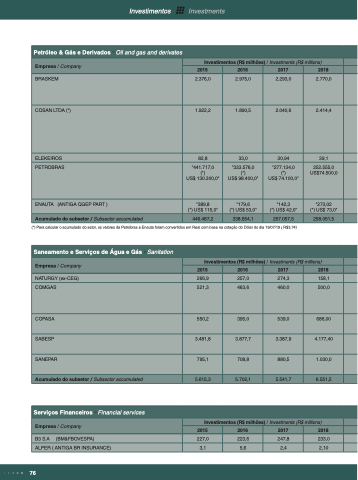
Petróleo & Gás e Derivados Oil and gas and derivates
Empresa / Company
Investimentos (R$ milhões) / Investments (R$ millions)
2015
2016
2017
2018
BRASKEM
2.376,0
2.975,0
2.293,0
2.770,0
COSAN LTDA (*)
1.922,2
1.890,5
2.040,6
2.414,4
ELEKEIROS
82,8
33,0
30,94
39,1
PETROBRAS
"441.717,0 (*)
US$ 130.300,0"
"333.576,0 (*)
US$ 98.400,0"
"277.134,0 (*)
US$ 74.100,0"
252.555,0 US$74.500,0
ENAUTA (ANTIGA QGEP PART )
"389,8
(*) US$ 115,0"
"179,6
(*) US$ 53,0"
"142,3
(*) US$ 42,0"
"273,02 (*) US$ 73,0"
446.487,2
338.654,1
257.057,5
258.051,5
(*) Para calcular o acumulado do setor, os valores da Petrobras e Enauta foram convertidos em Real com base na cotação do Dólar do dia 19/07/19 ( R$3,74)
Saneamento e Serviços de Água e Gás Sanitation
Empresa / Company
Investimentos (R$ milhões) / Investments (R$ millions)
2015
2016
2017
2018
NATURGY (ex-CEG)
266,9
257,0
274,3
158,1
COMGAS
521,3
463,6
460,0
500,0
COPASA
550,2
395,0
539,0
686,00
SABESP
3.481,8
3.877,7
3.387,9
4.177,40
SANEPAR
795,1
708,8
880,5
1.030,0
Acumulado do subsetor / Subsector accumulated
5.615,3
5.702,1
5.541,7
6.551,5
Serviços Financeiros Financial services
Empresa / Company
Investimentos (R$ milhões) / Investments (R$ millions)
2015
2016
2017
2018
B3 S.A (BM&FBOVESPA)
227,0
223,6
247,8
233,0
ALPER ( ANTIGA BR INSURANCE)
3,1
5,6
2,4
2,10
76
