
Page 42 - US Market Performance Report 1Q 2018
P. 42
$4,000,000,000
$3,500,000,000
$3,000,000,000
$2,500,000,000
$2,000,000,000
$1,500,000,000
$1,000,000,000
$500,000,000
$0
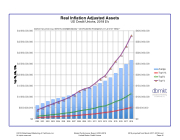
Real Inflation Adjusted Assets
US Credit Unions, 2018 $'s
SOURCE: NCUA 5300 CALL REPORTS, DECEMBER-ENDING **2018 PROJECTED FROM MARCH 2017-2018 YOY TREND**
2000 2001 2002 2003 2004 2005 2006 2007 2008 2009 2010 2011 2012 2013 2014 2015 2016 2017 2018
$400,000,000
$350,000,000
$300,000,000
$250,000,000
$200,000,000
$150,000,000
$100,000,000
$50,000,000
$0
Average Top 10% Top 5% Top 1%
©2018 Data Based Marketing of California, Inc. Market Performance Report: 2000-2018 2018 projected from March 2017-2018 trend All rights reserved. United States Credit Unions Page 40
Top 1%, 5%, 10%
