
Page 170 - North American & Caribbean Cruise Traveller
P. 170
Industry Insider:
North American & Caribbean Cruise Duty & Tax Free Retail 2015
8.2.1.2 LOWER PRIORITY AREAS
Product relevance and quality are aspects of the on-board convenience offer that are perceived more positively by North American & Caribbean cruise travellers. However, potential does exist to improve the overall perceptions of these aspects and in doing so, the overall perception of the convenience store offering.
Product Relevance...
The relevance of products available in on- board convenience stores is perceived as a slightly above average aspect of the channel among North American & Caribbean American cruise travellers, particularly for males and under 40s.
However, it should be noted that product relevance is an area unique to a shopper and their product need. Therefore operators should tailor product lines to meet the ‘everyday needs’ of different passenger types being targeted by a particular service or cruise type.
However, differing customer relevance is unavoidable to an extent. Therefore, to meet the needs of a wide range of passengers ensure that well-known brands best sellers are always available and prioritised in terms of shelf facings.
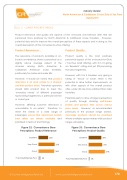
Figure 32: Convenience Store Perceptions: Product Relevance
Product Quality...
Product quality is the most positively perceived aspect of the on-board non-Duty / Tax Free retail offering, with 3 in 10 giving an ‘Excellent’ rating and just 3% perceiving the area negatively.
However, with 2 in 5 travellers only giving a rating of ‘Good’ or lower, there is the potential to drive further improvements. As with other aspects of the overall product offer, under 40s are more satisfied than older travellers.
Potential exists to drive stronger perceptions of quality through stocking well-known brands and product lines across various price levels. However, as recommended previously in the product range section, mid-range products should be prioritised where available space makes wide product ranges unfeasible.
Figure 33: Convenience Store Perceptions: Product Quality
Excellent Very Good Good Poor/Very/Extremely Poor
Excellent Very Good Good Poor/Very/Extremely Poor
22%
37%
36%
5%
29% 31%
37%
3%
© Counter Intelligence Retail Ltd www.counterintelligenceretail.com
170
