
Page 55 - North American & Caribbean Cruise Traveller
P. 55
Industry Insider:
North American & Caribbean Cruise Duty & Tax Free Retail 2015
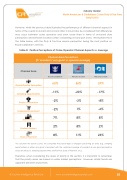
However, whilst the previous table illustrates the performance of different channel aspects in terms of the overall on-board and on-land offer, it should also be considered that differences may occur between cruise operators and even cruise liners in terms of on-board store perceptions and between locations when considering on-land port stores. We illustrate this in the table below, with the Duty & Tax Free service perception being the most positive on Royal Caribbean’s services.
Table 8: Positive Perceptions of Cruise Operator Channel Aspects vs. Average
*To calculate the above scores, we compared the percentage of shoppers perceiving an area (e.g. sampling opportunities) as either very good or excellent with the combined average of excellent & very good perceptions across all areas (i.e. Sampling Opportunities, Staff Service, Ease of Payment, etc.).
Therefore, when considering the areas of priority in this section, it is important to remember that the priority areas are based on wider market perceptions. However, similar trends are apparent between cruise liners.
Channel Area Perceptions
(% ‘excellent’/’very good’ vs operator average)
Channel Area
Royal Caribbean
Princess Cruises
Princess Cruises
Overall Positive Perception
65%
56%
57%
Sampling Opportunities
-11%
-23%
-17%
Product Information
-2%
-3%
-8%
Shopping Environment
-2%
1%
-6%
Staff Service
7%
8%
8%
Product Displays
2%
8%
2%
Ease of Payment
8%
11%
23%
© Counter Intelligence Retail Ltd www.counterintelligenceretail.com
55
