
Page 242 - ro membanes
P. 242
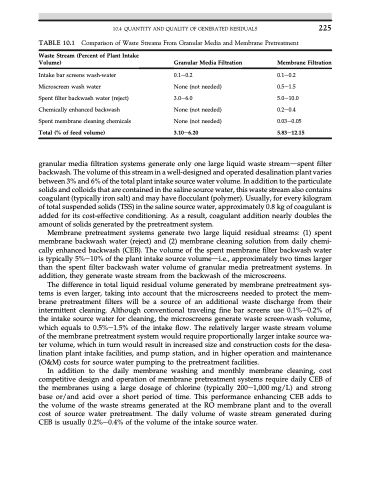
  10.4 QUANTITY AND QUALITY OF GENERATED RESIDUALS 225 TABLE 10.1 Comparison of Waste Streams From Granular Media and Membrane Pretreatment
 Waste Stream (Percent of Plant Intake Volume)
Intake bar screens wash-water Microscreen wash water
Spent filter backwash water (reject) Chemically enhanced backwash Spent membrane cleaning chemicals Total (% of feed volume)
Granular Media Filtration
0.1e0.2
None (not needed) 3.0e6.0
None (not needed) None (not needed) 3.10e6.20
Membrane Filtration
0.1e0.2 0.5e1.5 5.0e10.0 0.2e0.4 0.03e0.05 5.83e12.15
    granular media filtration systems generate only one large liquid waste streamdspent filter backwash. The volume of this stream in a well-designed and operated desalination plant varies between 3% and 6% of the total plant intake source water volume. In addition to the particulate solids and colloids that are contained in the saline source water, this waste stream also contains coagulant (typically iron salt) and may have flocculant (polymer). Usually, for every kilogram of total suspended solids (TSS) in the saline source water, approximately 0.8 kg of coagulant is added for its cost-effective conditioning. As a result, coagulant addition nearly doubles the amount of solids generated by the pretreatment system.
Membrane pretreatment systems generate two large liquid residual streams: (1) spent membrane backwash water (reject) and (2) membrane cleaning solution from daily chemi- cally enhanced backwash (CEB). The volume of the spent membrane filter backwash water is typically 5%e10% of the plant intake source volumedi.e., approximately two times larger than the spent filter backwash water volume of granular media pretreatment systems. In addition, they generate waste stream from the backwash of the microscreens.
The difference in total liquid residual volume generated by membrane pretreatment sys- tems is even larger, taking into account that the microscreens needed to protect the mem- brane pretreatment filters will be a source of an additional waste discharge from their intermittent cleaning. Although conventional traveling fine bar screens use 0.1%e0.2% of the intake source water for cleaning, the microscreens generate waste screen-wash volume, which equals to 0.5%e1.5% of the intake flow. The relatively larger waste stream volume of the membrane pretreatment system would require proportionally larger intake source wa- ter volume, which in turn would result in increased size and construction costs for the desa- lination plant intake facilities, and pump station, and in higher operation and maintenance (O&M) costs for source water pumping to the pretreatment facilities.
In addition to the daily membrane washing and monthly membrane cleaning, cost competitive design and operation of membrane pretreatment systems require daily CEB of the membranes using a large dosage of chlorine (typically 200e1,000 mg/L) and strong base or/and acid over a short period of time. This performance enhancing CEB adds to the volume of the waste streams generated at the RO membrane plant and to the overall cost of source water pretreatment. The daily volume of waste stream generated during CEB is usually 0.2%e0.4% of the volume of the intake source water.
