
Page 253 - ro membanes
P. 253
236
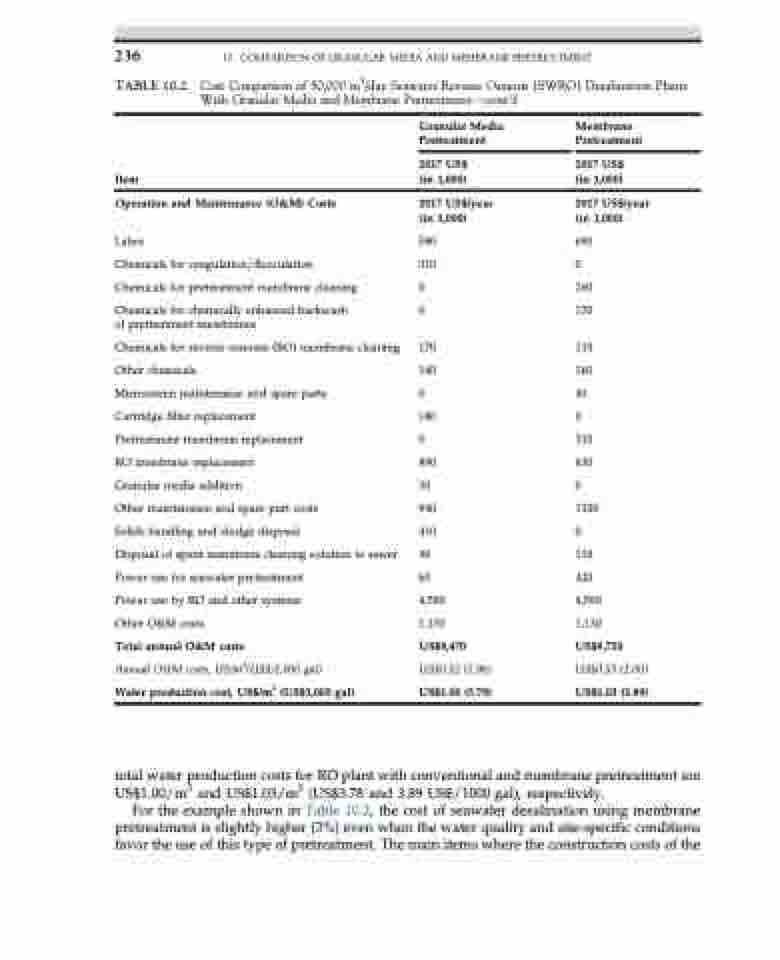
TABLE 10.2
10. COMPARISON OF GRANULAR MEDIA AND MEMBRANE PRETREATMENT
Cost Comparison of 50,000 m3/day Seawater Reverse Osmosis (SWRO) Desalination Plants
With Granular Media and Membrane Pretreatmentdcont’d
Granular Media Membrane
Item
Operation and Maintenance (O&M) Costs
Labor
Chemicals for coagulation/flocculation
Chemicals for pretreatment membrane cleaning
Chemicals for chemically enhanced backwash of pretreatment membranes
Chemicals for reverse osmosis (RO) membrane cleaning Other chemicals
Microscreen maintenance and spare parts
Cartridge filter replacement
Pretreatment membrane replacement
RO membrane replacement
Granular media addition
Other maintenance and spare part costs
Solids handling and sludge disposal
Disposal of spent membrane cleaning solution to sewer Power use for seawater pretreatment
Power use by RO and other systems
Other O&M costs
Total annual O&M costs
Annual O&M costs, US/m3(US$/1,000 gal) Water production cost, US$/m3 (US$1,000 gal)
Pretreatment
2017 US$ (in 1,000)
2017 US$/year (in 1,000)
580 310 0
0
170
140
0
180
0
890
30
940
410
40
60
4,590
1,130 US$9,470 US$0.52 (1.96) US$1.00 (3.78)
Pretreatment
2017 US$ (in 1,000)
2017 US$/year (in 1,000)
690 0 260 170
110
160
40
0
310
630
0
1100
0
110
420
4,590
1,130 US$9,720 US$0.53 (2.00) US$1.03 (3.89)
and membrane pretreatment are gal), respectively.
total water production costs for RO plant with conventional US$1.00/m3 and US$1.03/m3 (US$3.78 and 3.89 US$/1000
For the example shown in Table 10.2, the cost of seawater desalination using membrane pretreatment is slightly higher (3%) even when the water quality and site-specific conditions favor the use of this type of pretreatment. The main items where the construction costs of the
