
Page 204 - Algebra 1
P. 204
Exploration Making and Analyzing Biased Graphs
Your school district is discussing the possibility of requiring students to wear school uniforms. Your class was chosen to select the colors for the uniforms. They will be either blue or white. Each student should indicate a color preference.
9. Record the results in a table.
10. Make a bar graph of the data.
11. Draw a set of axes. Label the horizontal axis with the uniform colors. Label the vertical axis with the number of students.
12. Draw two bars, each with a height equal to the number of people who chose the color.
Create a biased bar graph of the data.
13. Draw a set of axes. Label the horizontal axis with the uniform
colors.
14. Use the colored squares of paper to create a blue or white column. If 5 students chose blue, then build a bar with 5 blue squares.
15. Analyze What is the difference between the two graphs you created?
Investigation Practice
Managers of an apartment complex want to know what visitors to the
complex think of the complex and the management office employees. They survey every fifth person who signs a lease.
a. What is the population?
b. Identify the sample.
c. Which of the following is the sampling method used?
A random B systematic
C stratified D voluntary
d. What is a possible bias for this survey?
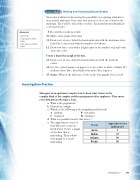
e. The approximate areas of
four different oceans are listed below. Create a graph of the data that is misleading. Then redraw your graph so it is not misleading.
Materials
• paper bag
• small squares of blue paper
• large squares of white paper
Ocean
Approximate area (million mi2)
Arctic
5
Indian
27
Atlantic
30
Pacific
60
Investigation 3 189
