
Page 330 - Algebra 1
P. 330
Equivalent inequalities are inequalities that have the same solution set.
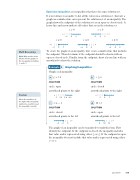
It is not always reasonable to list all the values in a solution set. Instead, a graph on a number line can represent the solution set of an inequality. The graph shows the endpoint of the solution set as an open or closed circle. A heavy line and arrow indicate all values that are in the solution set.
x>0 x<0
-2 0 2 -2 0 2
x≥0 x≤0 x≠0
-2 0 2
-2 0 2 -2 0 2
To create the graph of an inequality, first create a number line that includes the endpoint. Then determine if the endpoint should be shown with an open or closed circle. Finally, from the endpoint, draw a heavy line with an arrowhead to show the solution.
Graphing Inequalities
Math Reasoning
Write Why are the circles filled in for the graphs of the inequalities including ≥ and ≤?
Example
2
Graph each inequality.
a. g>5.8
SOLUTION
circle: open
arrowhead points to the right
5 5.4 5.8 6.2
c. x≤-2
SOLUTION
circle: closed
arrowhead points to the left
-4 -2 0
b. v≥6
SOLUTION
circle: closed
arrowhead points to the right
5 6 7
d. 10>f
SOLUTION
circle: open
arrowhead points to the left
8 10 12
Caution
When the variable is to the right of the inequality symbol, be careful to read the inequality correctly.
The graph of an inequality can be translated to symbolic form. First identify the endpoint. If the endpoint is closed, the inequality includes that value and is represented using either ≥ or ≤. If the endpoint is open, the inequality does not include that value and is represented using either > or <.
Lesson 50 315
