
Page 478 - Algebra 1
P. 478
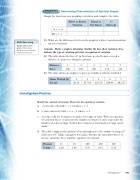
Exploration Determining Characteristics of Variation Graphs Graph the functions on a graphing calculator and complete the table.
11. What are the differences between the graph of a direct variation and an inverse variation?
Formulate Make a graph to determine whether the data show variation. If so, indicate the type of variation and write an equation of variation.
12. The table shows the force F, in Newtons, needed to move a rock a distance d, in meters, along the ground.
13. The table shows an employee’s pay p per number of hours worked h.
Investigation Practice
Identify the constant of variation. Then write the equation of variation.
a. y varies directly with x; y = 14 when x = 2.
b. w varies inversely with z; w = -8 when z = 3.
c. A recipe calls for 3 tomatoes to make 9 servings of salsa. Write an equation of variation where t represents the number of tomatoes and s represents the number of salsa servings. If Alex has 5 tomatoes, how many servings can he make?
d. The table compares the pressure P in atmospheres to the volume of oxygen V in liters at 0°C. Make a graph to determine whether the data show direct or inverse variation. If so, find the equation of variation.
Direct or Inverse Variation
Linear or Not Linear
x– Intercept
9. y = 3x
10. y = x
Math Reasoning
Analyze Why will the graph of the inverse function never reach the x-axis as x increases?
Distance
1
2
3
4
5
Force
600
300
200
150
120
Hours Worked (h)
1
2
3
4
5
Pay (p)
$8.50
$17.00
$25.50
$34.00
$42.50
Pressure
25
50
100
200
500
Volume
2.80
1.40
0.70
0.35
0.14
Investigation 7 463
