
Page 539 - Algebra 1
P. 539
Example
1
Using Experimental Probability
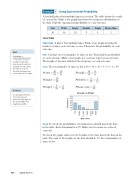
A baseball player bats multiple times in a season. The table shows the results of each at bat. Make a bar graph that shows the frequency distribution of the data. Find the experimental probability of each outcome.
SOLUTION
Understand A player bats multiple times. Make a bar graph showing the number of times each outcome occurs. Then state the probability of each outcome.
Plan Calculate the total number of times at bat. Then find the probability of each outcome. Make a bar graph. Let each bar represent an outcome. The height of the bars will show the frequency of each outcome.
Out
Walk
Single
Double
Triple
Home Run
30
36
20
9
3
1
Hint
P_robability i_s
number of favor
able outcomes total number of outcomes.
Use this to write the
ratio for each result. For example, for outs, write the ratio of 30 to 99 because the player was out 30 times in 99 at bats.
Solve Thetotalnumberof timesatbatis30+36+20+9+3+1=99. __ __
P(out)= 30 = 10 P(walk)= 36 = 4 99 33 99 11
P(single)=20 99
P(triple)=_3 =_1 99 33
P(double)= 9 = 1 99 11
P(homerun)=_1 99
Results of At Bat
Outcomes
___
Caution
In a bar graph, the bars do not touch each other. All of the bars are the same width. Their heights may differ.
60
50
40
30
20
10
0
524 Saxon Algebra 1
Check To check the probabilities, the numerators should match the data in the table. Each denominator is 99. Make sure fractions are reduced correctly.
To check the graph, make sure the heights of the bars match the data in the table. The sum of the heights of the bars should be 99, the total number of times at bat.
Out
Single
Double
Triple
Home Run
Walk
Frequency
