
Page 598 - Algebra 1
P. 598
8L A B
Characteristics of Parabolas
Graphing Calculator Lab (Use with Lesson 89)
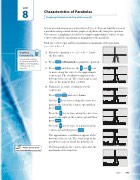
A zero of a function is an x-value where f(x) = 0. You can find the zeros of a parabola using a hand-drawn graph or algebraically using the equation. You can use a graphing calculator to compute approximate values, of any x-intercepts and the maximum or minimum of the parabola.
Find any x-intercepts and the maximum or minimum of the parabola y=-2x2 +4x-2.
1. Enter the equation y = -2x2 + 4x - 2 into the Y= editor.
2. Press 6:ZStandard to graph the equation.
3. Press and then use the and keys
to move along the curve to the approximate x-intercept. The coordinates appear at the bottom of the screen. The x-intercept occurs close to the point (1.064, -0.008).
4. Find more accurate coordinates of the x-intercept.
Press and select 2:zero.
Use the key to trace along the curve to a
point to the left of the x-intercept and then press .
Graphing Calculator Tip
For help with entering an equation into the Y = editor, see the Graphing Calculator Lab 3 on
page 305.
Press the
key to trace along the curve to a
point to the right of the x-intercept and then press .
key to trace to a point near the x-intercept and then press .
The approximate coordinates appear at the bottom of the screen. The x-intercept of the parabola occurs of about the point (1, 0).
For this parabola, the x-intercept is also the maximum of the function.
Press the
Online Connection www.SaxonMathResources.com
Lab 8 583
