Page 663 - Algebra 1
P. 663
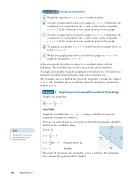
Exploration       Graphing Inequalities
a. Graph the equation y = x + 2 on a coordinate plane.
b. Test three points that lie above the graph of y = x + 2. Substitute the coordinates of each point for the x- and y-values in the inequality
y < x + 2. If the statement is true, mark the point of the graph.
c. Test three points that lie below the graph of y = x + 2. Substitute the coordinates of each point for the x- and y-values in the inequality
y < x + 2. If the statement is true, mark the point of the graph.
d. To graph the inequality y < x + 2, would you choose points above or below y = x + 2?
e. Would you graph points above or below the graph of y = x - 3 to graph the inequality y > x - 3?
A linear inequality describes a region of a coordinate plane called a half-plane. The boundary line for the region is the related equation.
To graph an inequality, begin by graphing the boundary line. Test points are helpful in deciding which half-plane makes the inequality true.
The boundary line is a dashed line when the inequality contains the symbol < or >. The boundary line is a solid line when the inequality contains the symbol ≤ or ≥.
Graphing Linear Inequalities without Technology
Graph each inequality.
a. y≥-_3x-3 4
SOLUTION
Graph the boundary line y = -_3 x - 3 using a solid line because the 4
inequality contains the symbol ≥.
Next use an ordered pair as a test point to find which half-plane should be
shaded on the coordinate plane. Test (0, 0).
Example
2
y
8
Hint
The point (0, 0) is a good test point if it is not on the boundary line.
4
648 Saxon Algebra 1
y ≥ - _3 x - 3 4
0 ≥ -_3 (0) - 3 4
0 ≥ -3
Evaluate for (0, 0). Simplify.
O
x
-8
-4
4
8
-4
The point (0, 0) satisfies the inequality, so it is a solution. The half-plane that contains the point should be shaded.
-8


