
Page 68 - Algebra 1
P. 68
INVES1TIGATION
Determining the Probability of an Event
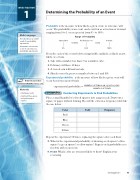
Probability is the measure of how likely a given event, or outcome, will occur. The probability of an event can be written as a fraction or decimal ranging from 0 to 1, or as a percent from 0% to 100%.
Range of Probability
As likely as not
Unlikely
0%
Describe each of the events below as impossible, unlikely, as likely as not,
likely, or certain.
1. Jake rolls a number less than 7 on a number cube. 2. February will have 30 days.
Impossible
Certain
Likely
50%
100%
Math Language
An outcome is a possible result of a probability experiment.
An event is an outcome or set of outcomes in a probability experiment.
3. A tossed coin will land on tails.
4. Shayla correctly guesses a number between 1 and 100.
Experimental probability is the measure of how likely a given event will
OnlineConnection occurbasedonrepeatedtrials.___ www.SaxonMathResources.com number of times an event occurs
experimental probability = number of trials Exploration Conducting Experiments to Find Probabilities
Materials
• small paper sacks
• small red, blue, green, and yellow paper squares
Place a small handful of colored squares into a paper sack. Draw out a square of paper without looking. Record the color in a frequency table like the one below.
Color
Tally
Frequency
Red
Blue
Green
Yellow
Repeat the experiment 50 times, replacing the square after each draw.
5. What is the experimental probability of drawing a red square? a blue square? a green square? a yellow square? Express each probability as a fraction and as a percent.
6. Predict Which color are you most likely to draw? Explain your reasoning.
Investigation 1 53
