
Page 845 - Algebra 1
P. 845
APPENDIX
L E1S S O N Graphing and Solving Nonlinear Inequalities
New Concepts
A quadratic inequality in two variables can be written in four different forms y<ax2 +bx+c y≤ax2 +bx+c
y>ax2 +bx+c y≥ax2 +bx+c
Using a procedure similar to graphing linear equalities a quadratic inequality
can be graphed.
Example
1
Graphing a Quadratic inequality
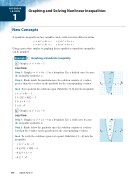
a. Graphy>x2 +4x-5. SOLUTION
Step 1: Graph y = x2 + 4x - 5 as a boundary. Use a dashed curve because the inequality symbol is >.
Step 2: Shade inside the parabola since the solution consists of y-values greater than the y-values on the parabola for the corresponding x-values.
Check Testapointinthesolutionregion.Substitute(1,3)intotheinequality y>x2 +4x-5
3 (1)2 +4(1)-5 3 1+4-5 3>0 ✓
b. Graphy≤x2 +2x-8. SOLUTION
Step 1: Graph y ≤ x2 + 2x - 8 as a boundary. Use a solid curve because the inequality symbol is ≤.
Step 2: Shade below the parabola since the solution consists of y-values less than the y-values on the parabola for the corresponding x-values.
Check Toverifythesolutionregiontestapoint.Substitute(3,-4)intothe inequality.
y≤x2 +2x-8 -4 (3)2 +2(3)-8 -4 9 + 6 - 8 -4≤7 ✓
y
8
4
O
x
-8
4
8
-4
y
8
4
O
x
-8
-4
4
8
830
Saxon Algebra 1
