
Page 849 - Algebra 1
P. 849
Example
3
Graphing a Step Function
Graph the function. f(x)=⎨⎧-1 ifx≤4
⎩3 if x > 4 SOLUTION
Graphing a step function is a lot like graphing inequalities. You will use open circles to indicate > or < and closed circles to show ≤ or ≥.
Begin by considering the function at x = 4. This is where the “steps” separate. Because f(4) = -1, graph the point (4, -1) with a closed circle. f(x) = -1 for x ≤ 4. Draw a ray from the point extending to the left, along the line y = -1. This is one horizontal step.
Next consider the other piece, f(x) = 3 for x > 4.
At (4, 3), draw an open circle because f(4) ≠ 3. Draw a ray going to the
right. This is another horizontal step.
Graphing a Piecewise Function
Graph the function.
⎧-2x+3 ifx≤-1 f(x)=⎨-5x if -1<x≤2
⎩ x 2 - 1 0 i f x > 2 SOLUTION
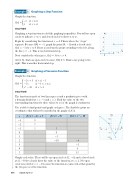
The function is made of two linear pieces and a quadratic piece with adomaindividedatx=-1andx=2.Findthevalueof thetwo surrounding functions for these values to see if the graph is continuous.
Use a table to find points and graph each piece. The shaded regions are coordinates that will not be included in the graph of f(x).
y
6
4
2
O
x
2
4
6
Example
4
x
f(x) = -2x + 3
f(x) = -5x
f(x)=x2 -10
-3
9
-2
7
-1
5
5
0
0
1
-5
2
-10
-6
3
-1
4
6
5
15
5
x
-4
-2
2
4
-5
-10
834
Saxon Algebra 1
Graph each value. There will be an open circle at (2, -6) and a closed circle at (2, -10) to clearly show the value of the function at x = 2. No open circle is needed at x = -1 because the function is connected at that point by the two pieces of the function.
10
y
