
Page 15 - 2018 YMCA of the Suncoast Annual Report
P. 15
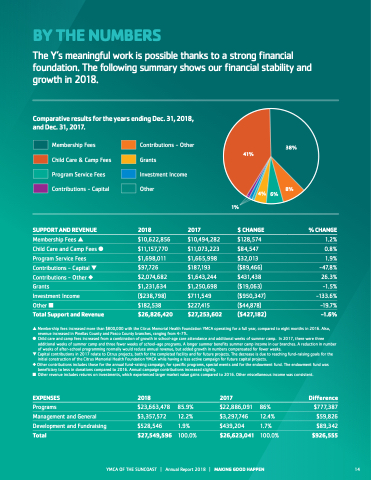
 BY THE NUMBERS
The Y’s meaningful work is possible thanks to a strong financial foundation. The following summary shows our financial stability and growth in 2018.
  Comparative results for the years ending Dec. 31, 2018, and Dec. 31, 2017.
Membership Fees
Child Care & Camp Fees Program Service Fees Contributions - Capital
SUPPORT AND REVENUE
Membership Fees s
Child Care and Camp Fees l
Program Service Fees
Contributions - Capital t
Contributions - Other u
Grants
Investment Income
Other n
Total Support and Revenue
Contributions - Other Grants
Investment Income Other
41%
1%
38%
4% 6% 8%
 2018
$10,622,856
$11,157,770
$1,698,011
$97,726
$2,074,682
$1,231,634
($238,798)
$182,538
$26,826,420
2017
$10,494,282
$11,073,223
$1,665,998
$187,193
$1,643,244
$1,250,698
$711,549
$227,415
$27,253,602
$ CHANGE
% CHANGE
 $128,574 1.2%
$84,547 0.8%
$32,013 1.9%
($89,466) -47.8%
$431,438 26.3%
($19,063) -1.5%
($950,347) -133.6%
($44,878) -19.7%
($427,182) -1.6%
        s Membership fees increased more than $800,000 with the Citrus Memorial Health Foundation YMCA operating for a full year, compared to eight months in 2016. Also, revenue increased in Pinellas County and Pasco County branches, ranging from 4–7%.
l Child care and camp fees increased from a combination of growth in school-age care attendance and additional weeks of summer camp. In 2017, there were three additional weeks of summer camp and three fewer weeks of school-age programs. A longer summer benefits summer camp income in our branches. A reduction in number of weeks of after-school programming normally would reduce annual revenue, but added growth in numbers compensated for fewer weeks.
t Capital contributions in 2017 relate to Citrus projects, both for the completed facility and for future projects. The decrease is due to reaching fund-raising goals for the initial construction of the Citrus Memorial Health Foundation YMCA while having a less active campaign for future capital projects.
u Other contributions includes those for the annual fund-raising campaign, for specific programs, special events and for the endowment fund. The endowment fund was beneficiary to less in donations compared to 2016. Annual campaign contributions increased slightly.
n Other revenue includes returns on investments, which experienced larger market value gains compared to 2016. Other miscellaneous income was consistent.
EXPENSES
Programs
Management and General
Development and Fundraising
Total
2018
$23,663,478 85.9%
$3,357,572 12.2%
$528,546 1.9%
$27,549,596 100.0%
2017 Difference
 $22,886,091 86%
$3,297,746 12.4%
$439,204 1.7%
$26,623,041 100.0%
$777,387
$59,826
$89,342
$926,555
    YMCA OF THE SUNCOAST | Annual Report 2018 | MAKING GOOD HAPPEN 14
