
Page 12 - 2019 Annual Report Tampa Metropolitan Area YMCA
P. 12
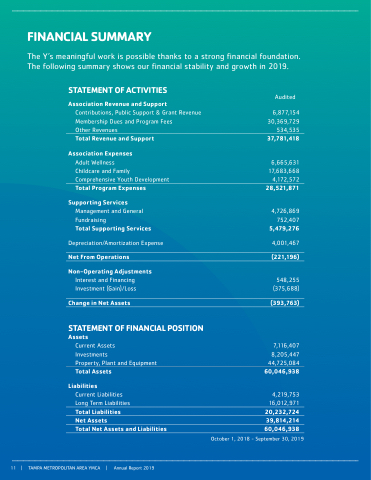
    FINANCIAL SUMMARY
The Y’s meaningful work is possible thanks to a strong financial foundation. The following summary shows our financial stability and growth in 2019.
STATEMENT OF ACTIVITIES
Association Revenue and Support
Contributions, Public Support & Grant Revenue Membership Dues and Program Fees
Other Revenues
Total Revenue and Support
Association Expenses
Adult Wellness
Childcare and Family Comprehensive Youth Development Total Program Expenses
Supporting Services
Management and General Fundraising
Total Supporting Services
Depreciation/Amortization Expense
Net From Operations
Non-Operating Adjustments
Interest and Financing Investment (Gain)/Loss
Change in Net Assets
STATEMENT OF FINANCIAL POSITION Assets
Current Assets
Investments
Property, Plant and Equipment Total Assets
Liabilities
Current Liabilities
Long Term Liabilities
Total Liabilities
Net Assets
Total Net Assets and Liabilities
Audited
6,877,154 30,369,729 534,535 37,781,418
6,665,631 17,683,668 4,172,572 28,521,871
4,726,869 752,407 5,479,276
4,001,467
(221,196)
548,255 (375,688)
(393,763)
7,116,407 8,205,447 44,725,084 60,046,938
4,219,753 16,012,971 20,232,724 39,814,214 60,046,938
            October 1, 2018 - September 30, 2019
   11 |
TAMPA METROPOLITAN AREA YMCA | Annual Report 2019
