
Page 12 - Tampa Metropolitan Area YMCA Annual Report 2015
P. 12
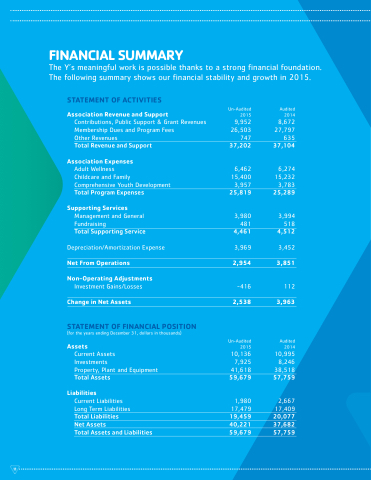
         FINANCIAL SUMMARY
The Y’s meaningful work is possible thanks to a strong financial foundation. The following summary shows our financial stability and growth in 2015.
 STATEMENT OF ACTIVITIES
Association Revenue and Support
Contributions, Public Support & Grant Revenues Membership Dues and Program Fees
Other Revenues
Total Revenue and Support
Association Expenses
Adult Wellness
Childcare and Family Comprehensive Youth Development Total Program Expenses
Supporting Services
Management and General
Fundraising 481
Un-Audited 2015
9,952 26,503 747 37,202
6,462 15,400 3,957 25,819
Audited 2014
8,672 27,797 635 37,104
6,274 15,232 3,783 25,289
3,994 518 4,512
3,452
3,851
112
3,963
Audited 2014
10,995 8,246 38,518 57,759
2,667 17,409 20,077 37,682 57,759
  Total Supporting Service
Depreciation/Amortization Expense
Net From Operations Non-Operating Adjustments
Investment Gains/Losses
Change in Net Assets
STATEMENT OF FINANCIAL POSITION
(for the years ending December 31, dollars in thousands)
4,461
3,969
2,954
-416
2,538
3,980
     Un-Audited Assets 2015
Current Assets 10,136 Investments 7,925
Property, Plant and Equipment
Total Assets
Liabilities
Current Liabilities
Long Term Liabilities
Total Liabilities
Net Assets
Total Assets and Liabilities
41,618
59,679
1,980 17,479 19,459 40,221 59,679
       11
