
Page 12 - Tampa Metropolitan Area YMCA Annual Report 2017
P. 12
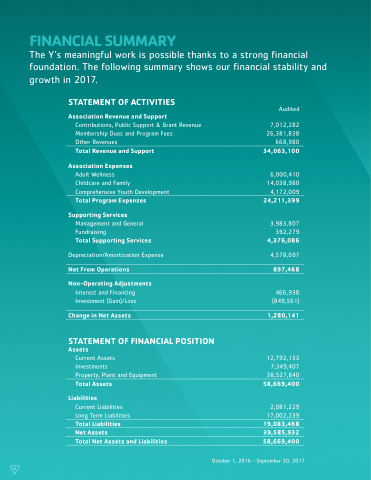
  FINANCIAL SUMMARY
The Y’s meaningful work is possible thanks to a strong financial foundation. The following summary shows our financial stability and growth in 2017.
STATEMENT OF ACTIVITIES
Association Revenue and Support
Contributions, Public Support & Grant Revenue Membership Dues and Program Fees
Other Revenues
Total Revenue and Support
Association Expenses
Adult Wellness
Childcare and Family Comprehensive Youth Development Total Program Expenses
Supporting Services
Management and General Fundraising
Total Supporting Services
Depreciation/Amortization Expense
Net From Operations
Non-Operating Adjustments
Interest and Financing Investment (Gain)/Loss
Change in Net Assets
STATEMENT OF FINANCIAL POSITION Assets
Current Assets
Investments
Property, Plant and Equipment Total Assets
Liabilities
Current Liabilities
Long Term Liabilities
Total Liabilities
Net Assets
Total Net Assets and Liabilities
Audited
7,012,282 26,381,838 668,980 34,063,100
6,000,410 14,038,980 4,172,009 24,211,399
3,983,807 392,279 4,376,086
4,578,097
897,468
466,938 (849,561)
1,280,141
12,792,153 7,349,407 38,527,840 58,669,400
2,081,229 17,002,239 19,083,468 39,585,932 58,669,400
           October 1, 2016 - September 30, 2017
 11
