
Page 12 - Tampa Metropolitan Area YMCA Annual Report 2021
P. 12
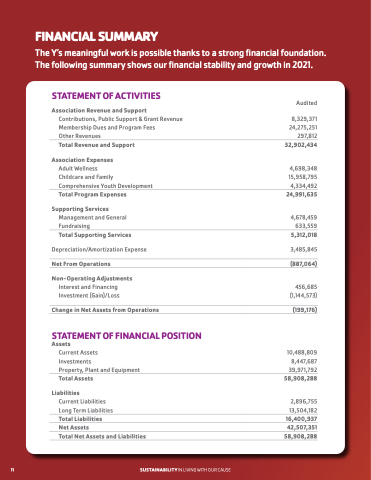
 FINANCIAL SUMMARY
The Y’s meaningful work is possible thanks to a strong financial foundation. The following summary shows our financial stability and growth in 2021.
 STATEMENT OF ACTIVITIES
Association Revenue and Support
Contributions, Public Support & Grant Revenue Membership Dues and Program Fees
Other Revenues
 Audited
8,329,371
24,275,251
297,812
 Total Revenue and Support
Association Expenses
Adult Wellness
Childcare and Family Comprehensive Youth Development
32,902,434
4,698,348
15,958,795
4,334,492
  Total Program Expenses
Supporting Services
Management and General Fundraising
24,991,635
4,678,459
633,559
  Total Supporting Services
Depreciation/Amortization Expense
5,312,018
3,485,845
  Net From Operations
 (887,064)
Non-Operating Adjustments
Interest and Financing Investment (Gain)/Loss
 456,685
(1,144,573)
  Change in Net Assets from Operations
 (199,176)
 STATEMENT OF FINANCIAL POSITION
Assets
Current Assets
Investments
Property, Plant and Equipment
10,488,809
8,447,687
39,971,792
  Total Assets
Liabilities
Current Liabilities Long Term Liabilities
58,908,288
2,896,755
13,504,182
  Total Liabilities
 16,400,937
 Net Assets
42,507,351
 Total Net Assets and Liabilities
  58,908,288
  11 SUSTAINABILITY IN LIVING WITH OUR CAUSE
