
Page 62 - Paragon Annual Report 2
P. 62
58 | Group financial statements
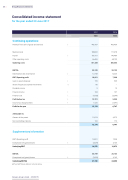
Consolidated income statement
for the year ended 30 June 2017
Continuing operations:
Revenue from sale of goods and services
Material costs Payroll
Other operating costs Operating costs
EBITDA
Depreciation and amortisation
EBIT/Operating profit
Gain on assets disposal
Share of equity accounted investments Dividend income
Finance income
Finance cost
Profit before tax
Income tax charge/(credit)
Profit for the year
Attributable to:
Owners of the parent Non-controlling interests
Supplementary information
EBIT/Operating profit Exceptional net (gains)/losses
Underlying EBIT
EBITDA
Exceptional net (gains)/losses
Underlying EBITDA
EBIT and EBITDA are defined in note 2(s) below.
3 400,439
171,678 5 140,489 68,139 380,306
20,133
4 12,225
7,908
4 539 13– 10 137
Notes
2017
€000
442,187
188,822
156,151
66,465
411,438
30,749
12,748
2016
€000
18,001
155
(4,728)
80
184
9
13,701
1,525
12,176
12,074
102
12,176
18,001
(3,029)
14,972
30,749
(3,029)
27,720
6 7 4 9
(3,244)
5,350
(1,397)
6,747
6,575 172
6,747
7,908 4,165
12,073
20,133
4,165
24,298
8
8
Paragon Group Limited – 05258175
