
Page 77 - Paragon Annual Report 2
P. 77
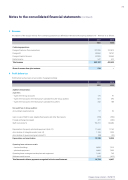
Notes to the consolidated financial statements (continued) 3 Revenue
An analysis of the Group’s revenue from continuing operations as defined by International Accounting Standard 18 − ‘Revenue’ is as follows:
| 73
2017
€000
272,785
80,960
87,895
442,187
547
518
2016
€000
Continuing operations
Paragon Customer Communications Paragon ID
Paragon Graphic Services
Rental income
Total revenue
Share of revenue from joint ventures
4 Profit before tax
Profit before tax has been arrived at after charging/(crediting):
Auditor’s remuneration:
Audit fees:
– Audit of the Group accounts
– Audit of the accounts of the Company’s subsidiaries by the Group auditors – Audit of the accounts of the Company’s subsidiaries by others
Non audit fees to Group auditors:
Accounting & taxation advice
Gain on sale of held for sale, tangible fixed assets and other fixed assets Foreign exchange loss/(gain)
Staff costs (note 5)
Depreciation of property, plant and equipment (note 10) Amortisation of intangible assets (note 14) Amortisation of government grants (note 21) Depreciation and amortisation
Operating lease minimum rentals:
– land and buildings
– plant and equipment
Operating lease contingent rentals plant and equipment
Sublease rental income
Total lease and sublease payments recognised in the Income Statement
221,813 78,747 99,469
410
400,439
–
91 396 188
92
(539)
(290) 140,489
11,162 1,095
(32)
12,225
7,219 7,033 765
(410)
14,607
2017
€000
156,151
175
821
342
57
(155)
477
11,668
1,108
12,748
(28)
8,835
6,860
1,646
(547)
16,794
2016
€000
Paragon Group Limited – 05258175
