
Page 88 - 143 Macquarie Street Annexure
P. 88
SYDNEY CBD OFFICE
< CONTENTS > SEPTEMBER 2019
MARKETBEATS
$1,045
Prime Gross Effective Rents (per sqm p.a)
5%
YoY Prime Gross Effective Rent growth
$820
B-Grade Gross Effective Rents (per sqm p.a)
HIGHLIGHTS
Small win for tenants: incentives rise
Prime Grade face rents held steady in Q3 and incentives appear to be trending up. Net face rents, recorded at $1,115 per sqm per annum, have recorded 5.5% annual growth, representative of a $60 YoY increase. Prime Grade gross incentives are now averaging closeto21%,upfrom20%atthesametimelastyear.Duetotheincreaseinfacerents, the value of incentives has increased by $25 per sqm to around $270 per sqm.
CBD vacancy rate less than 4%
Vacancy rates declined over the first half of 2019, according to data from the Property Council of Australia. The overall rate for the Sydney CBD was recorded at 3.7%, down from the 4.1% recorded at the end of H2 2018. Premium Grade stock has the tightest vacancy rate among all grades at just 2.7%. Nearly 200,000sqm of Premium Grade floorspace has been absorbed over the last three years.
2024 firming for the next supply wave
Sydney Metro sites are expected to form the backbone of Sydney’s next office supply wave. These include Pitt St North, 39 Martin Pl and 55 Hunter St, while Victoria Cross in North Sydney will compete. In addition, 55 Pitt St and 56 Pitt St are potential development projects, while central Barangaroo remains likely to add an as-yet unknown quantity of office space. Furthermore, potential refurbishments at 33 Alfred St and Grosvenor Pl (ex Deloitte) could lead to fierce competition for tenants among landlords.
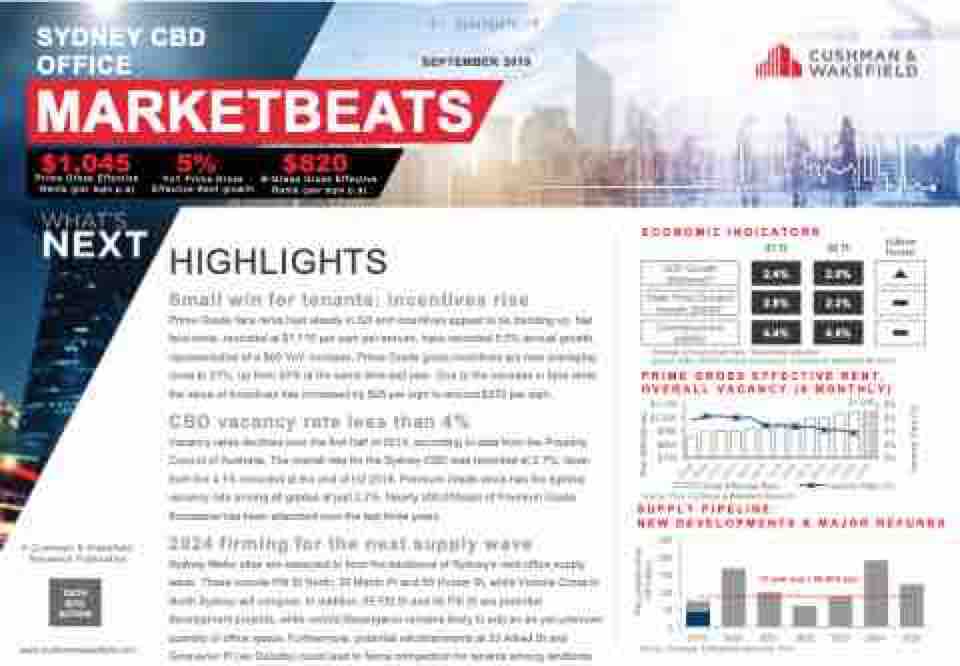
ECONOMIC INDICATORS
Q1 19
2.4%
2.8%
4.4%
Q2 19
2.0%
2.2%
4.6%
12-Month Forecast
GDP Growth (National)*
State Final Demand Growth (NSW)*
Unemployment (NSW)†
*Average annual growth rate, †Seasonally adjusted
Source: ABS; Deloitte Access Economics; Cushman & Wakefield Research
PRIME GROSS EFFECTIVE RENT, OVERALL VACANCY (6 MONTHLY)
$1,100 $1,000 $900 $800 $700
$1,045 8%
6% 4% 2% 0%
Vacancy Rate (%)
A Cushman & Wakefield Research Publication
www.cushmanwakefield.com
250 200 150 100
50
0 2019
10 year avg = 88,000 sqm
2020 2021 2022 2023 2024 2025
Gross Effective Rent
Source: PCA; Cushman & Wakefield Research
SUPPLY PIPELINE:
NEW DEVELOPMENTS & MAJOR REFURBS
DATA INTO ACTION
Source: Cushman & Wakefield Research; PCA
Net Lettable Area (‘000 sqm)
Rent (A$/sqm/yr)
Vacancy Rate (%)
