
Page 492 - Canadian BC Science 9
P. 492
474 MHR • Science Skill 5
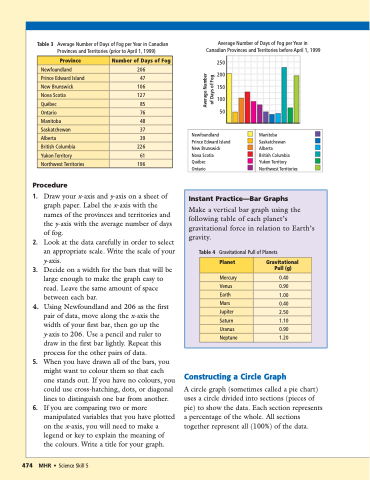
Table 3
Average Number of Days of Fog per Year in Canadian Provinces and Territories (prior to April 1, 1999)
Average Number of Days of Fog per Year in Canadian Provinces and Territories before April 1, 1999
250
200
150
100
50
Province
Number of Days of Fog
Newfoundland
206
Prince Edward Island
47
New Brunswick
106
Nova Scotia
127
Québec
85
Ontario
76
Manitoba
48
Saskatchewan
37
Alberta
39
British Columbia
226
Yukon Territory
61
Northwest Territories
196
Newfoundland Prince Edward Island New Brunswick Nova Scotia
Québec
Ontario
Manitoba Saskatchewan Alberta
British Columbia Yukon Territory Northwest Territories
Procedure
1. Draw your x-axis and y-axis on a sheet of graph paper. Label the x-axis with the names of the provinces and territories and the y-axis with the average number of days of fog.
2. Look at the data carefully in order to select an appropriate scale. Write the scale of your y-axis.
3. Decide on a width for the bars that will be large enough to make the graph easy to read. Leave the same amount of space between each bar.
4. Using Newfoundland and 206 as the first pair of data, move along the x-axis the width of your first bar, then go up the y-axis to 206. Use a pencil and ruler to draw in the first bar lightly. Repeat this process for the other pairs of data.
5. When you have drawn all of the bars, you might want to colour them so that each one stands out. If you have no colours, you could use cross-hatching, dots, or diagonal lines to distinguish one bar from another.
6. If you are comparing two or more manipulated variables that you have plotted on the x-axis, you will need to make a legend or key to explain the meaning of the colours. Write a title for your graph.
Constructing a Circle Graph
A circle graph (sometimes called a pie chart) uses a circle divided into sections (pieces of pie) to show the data. Each section represents a percentage of the whole. All sections together represent all (100%) of the data.
Instant Practice—Bar Graphs
Make a vertical bar graph using the following table of each planet’s gravitational force in relation to Earth’s gravity.
Table 4 Gravitational Pull of Planets
Planet
Gravitational Pull (g)
Mercury
0.40
Venus
0.90
Earth
1.00
Mars
0.40
Jupiter
2.50
Saturn
1.10
Uranus
0.90
Neptune
1.20
Average Number of Days of Fog
