
Page 421 - Chemistry--atom first
P. 421
Chapter 8 | Gases 411
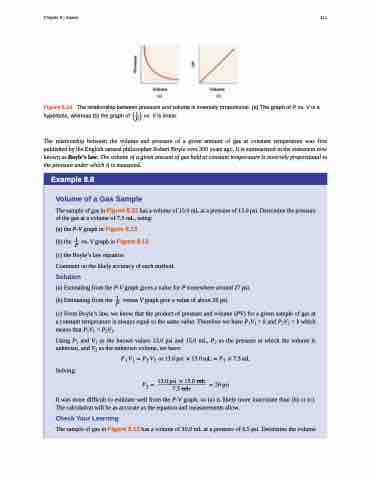
Figure 8.14 The relationship between pressure and volume is inversely proportional. (a) The graph of P vs. V is a hyperbola, whereas (b) the graph of ������ vs. V is linear.
The relationship between the volume and pressure of a given amount of gas at constant temperature was first published by the English natural philosopher Robert Boyle over 300 years ago. It is summarized in the statement now known as Boyle’s law: The volume of a given amount of gas held at constant temperature is inversely proportional to the pressure under which it is measured.
Example 8.8
Volume of a Gas Sample
The sample of gas in Figure 8.13 has a volume of 15.0 mL at a pressure of 13.0 psi. Determine the pressure of the gas at a volume of 7.5 mL, using:
(a) the P-V graph in Figure 8.13
(b) the �� vs. V graph in Figure 8.13
(c) the Boyle’s law equation
Comment on the likely accuracy of each method.
Solution
(a) Estimating from the P-V graph gives a value for P somewhere around 27 psi.
(b) Estimating from the �� versus V graph give a value of about 26 psi.
(c) From Boyle’s law, we know that the product of pressure and volume (PV) for a given sample of gas at a constant temperature is always equal to the same value. Therefore we have P1V1 = k and P2V2 = k which means that P1V1 = P2V2.
Using P1 and V1 as the known values 13.0 psi and 15.0 mL, P2 as the pressure at which the volume is unknown, and V2 as the unknown volume, we have:
Solving:
���� ����� ��������� ���������� ������ ��� �������������� ������
��� ��
It was more difficult to estimate well from the P-V graph, so (a) is likely more inaccurate than (b) or (c). The calculation will be as accurate as the equation and measurements allow.
Check Your Learning
The sample of gas in Figure 8.13 has a volume of 30.0 mL at a pressure of 6.5 psi. Determine the volume
