
Page 40 - The Principle of Economics
P. 40
38 PART ONE
INTRODUCTION
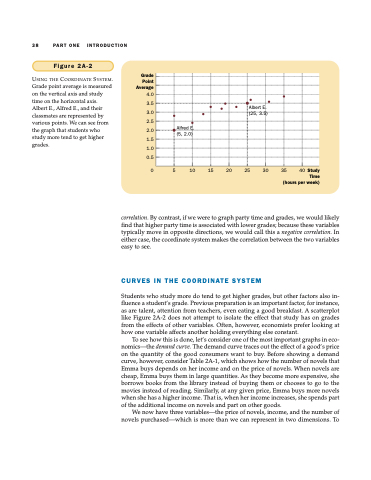
Figure 2A-2
Albert E.
(25, 3.5)
Alfred E.
(5, 2.0)
Grade Point Grade point average is measured Average
on the vertical axis and study 4.0
USING THE COORDINATE SYSTEM.
time on the horizontal axis.
Albert E., Alfred E., and their
classmates are represented by
various points. We can see from
the graph that students who 2.0 study more tend to get higher
3.5 3.0 2.5
grades.
1.5 1.0 0.5
0 5 10 15 20 25 30 35 40Study Time (hours per week)
correlation. By contrast, if we were to graph party time and grades, we would likely find that higher party time is associated with lower grades; because these variables typically move in opposite directions, we would call this a negative correlation. In either case, the coordinate system makes the correlation between the two variables easy to see.
CURVES IN THE COORDINATE SYSTEM
Students who study more do tend to get higher grades, but other factors also in- fluence a student’s grade. Previous preparation is an important factor, for instance, as are talent, attention from teachers, even eating a good breakfast. A scatterplot like Figure 2A-2 does not attempt to isolate the effect that study has on grades from the effects of other variables. Often, however, economists prefer looking at how one variable affects another holding everything else constant.
To see how this is done, let’s consider one of the most important graphs in eco- nomics—the demand curve. The demand curve traces out the effect of a good’s price on the quantity of the good consumers want to buy. Before showing a demand curve, however, consider Table 2A-1, which shows how the number of novels that Emma buys depends on her income and on the price of novels. When novels are cheap, Emma buys them in large quantities. As they become more expensive, she borrows books from the library instead of buying them or chooses to go to the movies instead of reading. Similarly, at any given price, Emma buys more novels when she has a higher income. That is, when her income increases, she spends part of the additional income on novels and part on other goods.
We now have three variables—the price of novels, income, and the number of novels purchased—which is more than we can represent in two dimensions. To
