
Page 355 - Sociology and You
P. 355
Chapter 10 Inequalities of Gender and Age 325
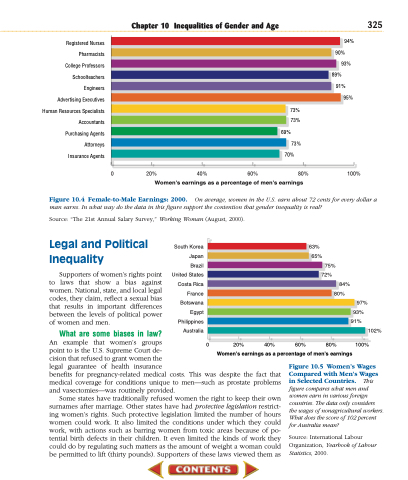
Registered Nurses Pharmacists College Professors Schoolteachers Engineers Advertising Executives Human Resources Specialists Accountants Purchasing Agents Attorneys Insurance Agents
94% 90%
93% 89%
91% 95%
73% 73%
69% 73%
70%
0 20%
40% 60%
80% 100%
Women’s earnings as a percentage of men’s earnings
Figure 10.4 Female-to-Male Earnings: 2000. On average, women in the U.S. earn about 72 cents for every dollar a man earns. In what way do the data in this figure support the contention that gender inequality is real?
Source: “The 21st Annual Salary Survey,” Working Woman (August, 2000).
Legal and Political Inequality
Supporters of women’s rights point to laws that show a bias against women. National, state, and local legal codes, they claim, reflect a sexual bias that results in important differences between the levels of political power of women and men.
What are some biases in law?
An example that women’s groups
point to is the U.S. Supreme Court de-
cision that refused to grant women the
legal guarantee of health insurance
benefits for pregnancy-related medical costs. This was despite the fact that medical coverage for conditions unique to men—such as prostate problems and vasectomies—was routinely provided.
Some states have traditionally refused women the right to keep their own surnames after marriage. Other states have had protective legislation restrict- ing women’s rights. Such protective legislation limited the number of hours women could work. It also limited the conditions under which they could work, with actions such as barring women from toxic areas because of po- tential birth defects in their children. It even limited the kinds of work they could do by regulating such matters as the amount of weight a woman could be permitted to lift (thirty pounds). Supporters of these laws viewed them as
Figure 10.5 Women’s Wages Compared with Men’s Wages in Selected Countries. This figure compares what men and women earn in various foreign countries. The data only considers the wages of nonagricultural workers. What does the score of 102 percent for Australia mean?
Source: International Labour Organization, Yearbook of Labour Statistics, 2000.
South Korea Japan Brazil United States Costa Rica France Botswana Egypt Philippines Australia
0
63% 65%
75% 72%
84% 80%
97% 93%
91%
102%
20%
40%
60%
80% 100%
Women’s earnings as a percentage of men’s earnings
