
Page 396 - Sociology and You
P. 396
366
Unit 4 Social Institutions
30
28
26
24
22
20
18
1900 1920 1940
Men
Women
1998
“No matter how many communes anybody invents, the family always creeps back.
Margaret Mead anthropologist
because people are more likely to make changes and take chances when they are not worried about basic survival.
Second, the rise in the divorce rate after 1960 followed the growing up of the baby-boom generation. Baby boomers did not attach a stigma to divorce the way earlier generations did and so were more likely to leave unhappy marriages than to stay.
Third, the increasing financial independence of women means they are more willing to end bad marriages. They are not as dependent (especially if there are no children) upon the husband’s willingness to support an ex.
Fourth, American values and attitudes about marriage and divorce are changing. Society is much more forgiving of divorce and remarriage. Women, especially, are no longer “punished,” as they were in the past, for leaving a marriage.
What does the future for marriage look like? For several reasons, there is a good chance that the recent decline in the U.S. divorce rate may continue:
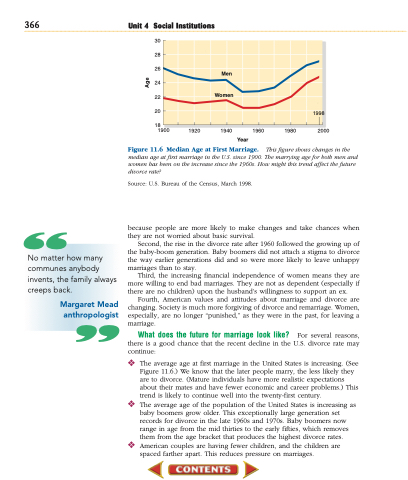
❖ The average age at first marriage in the United States is increasing. (See Figure 11.6.) We know that the later people marry, the less likely they are to divorce. (Mature individuals have more realistic expectations about their mates and have fewer economic and career problems.) This trend is likely to continue well into the twenty-first century.
❖ The average age of the population of the United States is increasing as baby boomers grow older. This exceptionally large generation set records for divorce in the late 1960s and 1970s. Baby boomers now range in age from the mid thirties to the early fifties, which removes them from the age bracket that produces the highest divorce rates.
❖ American couples are having fewer children, and the children are spaced farther apart. This reduces pressure on marriages.
Figure 11.6 Median Age at First Marriage.
Year
This figure shows changes in the median age at first marriage in the U.S. since 1900. The marrying age for both men and
women has been on the increase since the 1960s. How might this trend affect the future divorce rate?
Source: U.S. Bureau of the Census, March 1998.
1960 1980 2000
Age
“
