
Page 79 - Sociology and You
P. 79
Chapter 2 Sociologists Doing Research 49
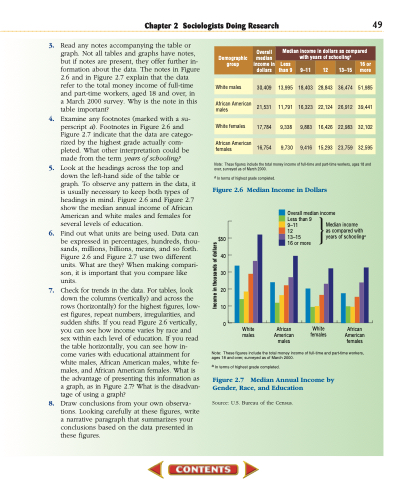
3. Read any notes accompanying the table or graph. Not all tables and graphs have notes, but if notes are present, they offer further in- formation about the data. The notes in Figure 2.6 and in Figure 2.7 explain that the data refer to the total money income of full-time and part-time workers, aged 18 and over, in a March 2000 survey. Why is the note in this table important?
4. Examine any footnotes (marked with a su- perscript a). Footnotes in Figure 2.6 and Figure 2.7 indicate that the data are catego- rized by the highest grade actually com- pleted. What other interpretation could be made from the term years of schooling?
5. Look at the headings across the top and down the left-hand side of the table or graph. To observe any pattern in the data, it is usually necessary to keep both types of headings in mind. Figure 2.6 and Figure 2.7 show the median annual income of African American and white males and females for several levels of education.
6. Find out what units are being used. Data can be expressed in percentages, hundreds, thou- sands, millions, billions, means, and so forth. Figure 2.6 and Figure 2.7 use two different units. What are they? When making compari- son, it is important that you compare like units.
7. Check for trends in the data. For tables, look down the columns (vertically) and across the rows (horizontally) for the highest figures, low- est figures, repeat numbers, irregularities, and sudden shifts. If you read Figure 2.6 vertically, you can see how income varies by race and sex within each level of education. If you read the table horizontally, you can see how in- come varies with educational attainment for white males, African American males, white fe- males, and African American females. What is the advantage of presenting this information as a graph, as in Figure 2.7? What is the disadvan- tage of using a graph?
8. Draw conclusions from your own observa- tions. Looking carefully at these figures, write a narrative paragraph that summarizes your conclusions based on the data presented in these figures.
Less
than 9 9–11 12
16 or 13–15 more
Demographic group
Overall
median income in dollars
Median income in dollars as compared with years of schoolinga
White males
30,409
13,995 18,403 28,843 36,474 51,985 11,791 16,323 22,124 26,912 39,441 9,338 9,883 16,426 22,983 32,102 9,730 9,416 15,293 23,759 32,595
Note: These figures include the total money income of full-time and part-time workers, ages 18 and over, surveyed as of March 2000.
a In terms of highest grade completed.
Figure 2.6 Median Income in Dollars
African American males
21,531
White females
17,784
African American females
16,754
$50 40 30 20 10 0
Less than 9 9–11
12
13–15
16 or more
Median income
as compared with years of schoolinga
Overall median income
White males
African American males
White females
African American females
Note: These figures include the total money income of full-time and part-time workers, ages 18 and over, surveyed as of March 2000.
a In terms of highest grade completed.
Figure 2.7 Median Annual Income by Gender, Race, and Education
Source: U.S. Bureau of the Census.
Income in thousands of dollars
