
Page 13 - S44 Compendium
P. 13
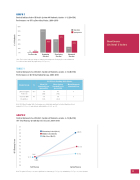
GRAPH 1
Central Indiana School District System 44 Students, Grades 3–12 (N=159) Performance on SPI by Decoding Status, 2009–2010
60% 50% 40% 30% 20% 10%
0%
1%
2%
Fall 2009 Spring 2010
53%
41%
30%
31%
28%
14%
Pre-Decoder
Beginning Decoder
Developing Decoder
Advanced Decoder
Note. The increase in the percentage of students performing at the Developing Decoder or Advanced Decoder level was statistically signi cant (t=5.67, p=.00).
TABLE 1
Central Indiana School District System 44 Students, Grades 3–12 (N=159) Performance on WJ III by Student Group, 2009–2010
Student Group
N
WJ lll Basic Reading Skills Cluster
Mean Fall Standard Score (percentile)
Mean Spring Standard Score (percentile)
Mean Change in Standard Score
Limited-English Pro cient
116
74 (4th)
80 (9th)
6
Students With Disabilities
49
64 (1st)
68 (2nd)
3
Note. WJ lll Basic Reading Skills Cluster gains were statistically signi cant for limited-English pro cient students (t=5.35, p=.00) and students with disabilities (t=3.62, p=.01).
GRAPH 2
Central Indiana School District System 44 Students, Grades 3–12 (N=159) SPI Total Fluency Growth by School Level, 2009–2010
22
21
20
19    High School (N=33) 18
Elementary School (N=33) Middle School (N=93)
20.85
15.83 13.52
Spring Fluency
17
16
15
14
13
12 11 10
12.6 12.3
12.06
Fall Fluency
Note. The gains in Fluency score were signi cant for elementary (t=7.31, p=.00) and middle (t=5.07, p=.00) school students.
Northern United States
11
SPI Fluency Score % of Students
