
Page 17 - Prairie Land 2025-2028
P. 17
We recognize that a one-size-fits- all approach does not suffice in addressing the unique needs of our diverse student population. Thus, we proactively adapt our learning environments to meet individual needs, ensuring that each student can find a pathway to success tailored specifically to them. This approach is underpinned by our dedication to continuous growth and the setting of high expectations for all members of our community.
Our commitment extends beyond mere academic success; we aim to empower our students to excel in all facets of life, fostering resilience, creativity, and the capacity to navigate the complexities of an ever-changing world.
Prairie Land Continuum of Supports
Measures:
Alberta Education Assurance Surveys
Family Resource Worker - student surveys
FRW/psychologist statistics
verall arent tudent eacher
students agree that students are safe
730 88.3 914 86.6 1064 86.0 1011 85.2
100
75
50
25
0
Overall
Parent
2023 2024
Teacher
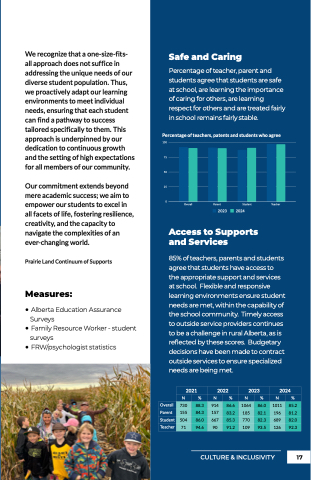
Safe and Caring
2021 2022 2023 2024
Percentage of teacher, parent and N%N%N%N%
at school, are learning the importance
155 84.3 157 83.2 185 82.1 196 81.2
o5f0c4arin8g6.f0oro6t6h7ers,8a5r.3elea77rn0ing82.3 689 82.0 re7s1pect94fo.6r oth90ers a9n1d.2 are10tr9eate93d.5fairl1y26 92.3 in school remains fairly stable.
Percentage of teachers, patents and students who agree
Access to Supports and Services
85% of teachers, parents and students agree that students have access to the appropriate support and services at school. Flexible and responsive learning environments ensure student needs are met, within the capability of the school community. Timely access to outside service providers continues to be a challenge in rural Alberta, as is reflflected by these scores. Budgetary decisions have been made to contract outside services to ensure specialized needs are being met.
Student
Overall
Parent
Student
Teacher
N
730
155
504
71
2021
%
88.3
84.3
86.0
94.6
N
914
157
667
90
2022
%
86.6
83.2
85.3
91.2
N
1064
185
770
109
2023
%
86.0
82.1
82.3
93.5
N
1011
196
689
126
2024
%
85.2
81.2
82.0
92.3
Percentage of teachers, patents and students who agree
100
CULTURE & INCLUSIVITY
75
17
O P S T
50
