
Page 3 - ANZCP Gazette April 2021 TEASER
P. 3
50% dextrose addition from June 2020 onwards. Cardioplegia was delivered at a 4:1 ratio: 4 parts autologous blood from the CPB circuit and 1 part crystalloid. Cardioplegia was delivered using the CPB circuit with heat exchanger and pressure control in an antegrade, retrograde or ostial fashion depending on surgeon preference. There was an average induction dose of 240 mL crystalloid with maintenance doses of 100 mL crystalloid delivered approximately every 20 minutes.
Preoperative and intraoperative clinical variables were recorded including: CPB time, aortic cross-clamp time, diabetes and diabetes control, patient age and gender, serum glucose levels on standard ABGs (approximately every 30 minutes) and intraoperative use of insulin. Postoperative variables included: serum glucose levels on standard ABGs in the OR and intensive care unit (ICU) for six hours post-op, maximum troponin levels <12 hours post-op, ventilation time, ICU and hospital stay, sepsis, stroke, deep sternal wound infection, death and <30-day mortality.
An analysis of the results assessed: changes in blood glucose from pre-CPB to maximum blood glucose during CPB, post- CPB in the OR and the maximum blood glucose <6 hours in ICU, the frequency of hyperglycaemia and hypoglycaemia, and group difference between the clinical variables listed above.
Results
A total of 100 adult patients were included in the study, with 50 patients per group. The two groups showed no statistically significant difference with respect to: age, gender, procedure type, insulin during CPB or X-Clamp and CPB time (Table 1).
����� �� ������������ ������������ ��� �������������� ���� ��� ���������� ������� ������
CPB in OR, CpD = 22% hyperglycaemia and Cp0 = 20% (p =0.81)or<6hoursinICU,CpD=34%andCp0=32%(p= 0.83) (Figure 2). No patients were hypoglycaemic at any time point measured.
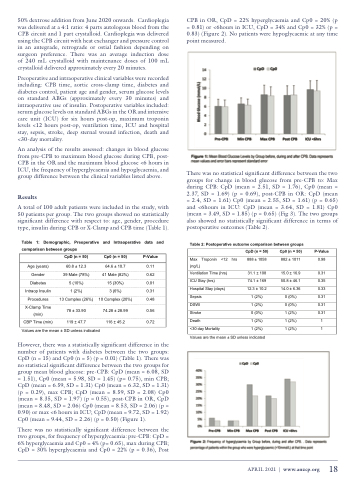
There was no statistical significant difference between the two groups for change in blood glucose from pre-CPB to: Max during CPB: CpD (mean = 2.51, SD = 1.76), Cp0 (mean = 2.37, SD = 1.69) (p = 0.69), post-CPB in OR: CpD (mean = 2.4, SD = 1.61) Cp0 (mean = 2.55, SD = 1.61) (p = 0.65) and <6hours in ICU: CpD (mean = 3.64, SD = 1.81) Cp0 (mean = 3.49, SD = 1.85) (p = 0.65) (Fig 3). The two groups also showed no statistically significant difference in terms of postoperative outcomes (Table 2).
� � � �� � � � � � ������ �������� ������� ������� ���������� ������� ����
�����
� � � � � � � �� � � �
����
��� �� � ���
� � �� � � � �� �����������
� �����
� ��� �
� � ������� ���� �
� � � � � �� �
��� �� � ���
� � �� � � � ��
�� ��������� ����
�� ����� ���� � ��� � ����
� � ������� ��� � � ���� � � �� � � � � �� � ���� � � � � � � �� ����
� � � � � � ��
������ ��� ��� ���� � �� ������ ���������
����� �����
� �
However, there was a statistically significant difference in the number of patients with diabetes between the two groups: CpD (n = 15) and Cp0 (n = 5) (p = 0.01) (Table 1). There was no statistical significant difference between the two groups for group mean blood glucose: pre-CPB: CpD (mean = 6.08, SD = 1.51), Cp0 (mean = 5.98, SD = 1.45) (p= 0.75), min CPB; CpD (mean = 6.59, SD = 1.31) Cp0 (mean = 6.32, SD = 1.31) (p = 0.29), max CPB; CpD (mean = 8.59, SD = 2.08) Cp0 (mean = 8.35, SD = 1.97) (p = 0.55), post-CPB in OR, CpD (mean = 8.48, SD = 2.06) Cp0 (mean = 8.53, SD = 2.06) (p = 0.90) or max <6 hours in ICU; CpD (mean = 9.72, SD = 1.92) Cp0 (mean = 9.44, SD = 2.26) (p = 0.50) (Figure 1).
There was no statistically significant difference between the two groups, for frequency of hyperglycaemia: pre-CPB: CpD = 6% hyperglycaemia and Cp0 = 4% (p= 0.65), max during CPB; CpD = 30% hyperglycaemia and Cp0 = 22% (p = 0.36), Post
�������
��� �������� ��� ���
������
��������������������
������������
������������������
������ ����� ���� ����� ������ ����� ����� ����� �� � ��� ��������� � ��� �
������ ��� ��� ���� � �� ������ ���������
����� �� ������������� ������� ���������� ������� ������
��� �� � ���
��� �� � ���
�������
��������
�������� ����
� ��� �� ��� ���� ��������� ���� ���� ����� ����
����� ���� ����� ���� ����� ����
�� �� �� � � ���� ���� ���� �����
APRIL 2021 | www.anzcp.org
18
