
Page 34 - Demo
P. 34
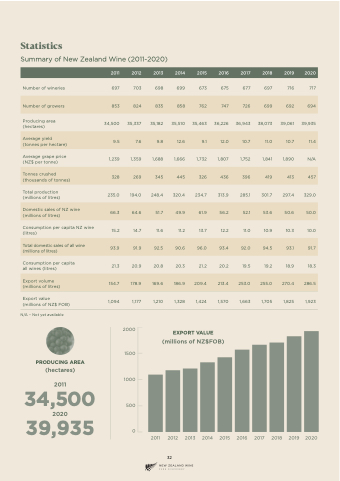
 Statistics
Summary of New Zealand Wine (2011-2020)
 2011
2012
2013
2014
2015
2016
2017
2018
2019
2020
Number of wineries
Producing area (hectares)
Average grape price (NZ$ per tonne)
Total production (millions of litres)
Consumption per capita NZ wine (litres)
Consumption per capita all wines (litres)
Export value
(millions of NZ$ FOB)
N/A – Not yet available
PRODUCING AREA
697 703
34,500 35,337
1,239 1,359
235.0 194.0
15.2 14.7
21.3 20.9
1,094 1,177
2000
1500
1000
698
35,182
1,688
248.4
11.6
20.8
1,210
699
35,510
1,666
320.4
11.2
20.3
1,328
673
35,463
1,732
234.7
13.7
21.2
1,424
675
36,226
1,807
313.9
12.2
20.2
1,570
677 697
36,943 38,073
1,752 1,841
285.1 301.7
11.0 10.9
19.5 19.2
1,663 1,705
716 717
39,061 39,935
1,890 N/A
297.4 329.0
10.3 10.0
18.9 18.3
1,825 1,923
 Number of growers
853
824
835
858
762
747
726
699
692
694
Average yield (tonnes per hectare)
9.5
7.6
9.8
12.6
9.1
12.0
10.7
11.0
10.7
11.4
Tonnes crushed (thousands of tonnes)
328
269
345
445
326
436
396
419
413
457
Domestic sales of NZ wine (millions of litres)
66.3
64.6
51.7
49.9
61.9
56.2
52.1
53.6
50.6
50.0
Total domestic sales of all wine (millions of litres)
93.9
91.9
92.5
90.6
96.0
93.4
92.0
94.5
93.1
91.7
Export volume (millions of litres)
 154.7
 178.9
 169.6
 186.9
 209.4
 213.4
 253.0
 255.0
 270.4
 286.5
     EXPORT VALUE
       (hectares) 2011
   34,500
500
2020
39,935
0
(millions of NZ$FOB)
2011 2012
2013 2014 2015
2016 2017
2018 2019 2020
32
