
Page 22 - Ratti Group - Sustainability report
P. 22
CH. 2 | THE PASSION OF SAVOIR-FAIRE
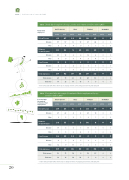
TAB 5 - Newly hired employees by age, gender and country at 31 December 2017*
Newly hired employees
Over 50 years
Total men
RATTI GROUP
2016
Women 0
Men 0
Women 0
Men 1
Women 0
Men 0
37
30
80
4
2017
67
57
4
2
2016
14
10
7
4
ITALY
2017
22
13
10
4
36
2
TUNISIA
2016
27
21
50
0
2017
45
44
0
55
0
ROMANIA
2016
0
0
0
2017
Below 30 years
42
28
0
5
10
4
9
1
1
0
Between
30 and 50 years
21
9
10
1
22
6
6
16
6
0
8
12
9
3
4
5
4
0
8
1
0
0
0
Total employees
4
92
2
30
3
2
1
0
0
0
1
Total women
63
20
43
17
71
21
10
21
15
7
50
5
0
0
0
1
*In the China and USA o ces there was no change in terms of incoming personnel in 2016 and 2017.
Personnel who interrupted/ terminated their employment
Women 0
Men 0
Women 0
Men 0
Women 0
Men 0
* In the China and USA o ces there was no change in terms of outgoing personnel in 2016 and 2017.
TAB 6 - Personnel who interrupted/terminated their employment, by age at 31 December 2017*
RATTI GROUP
2016
2017
2016
ITALY
2017
TUNISIA
2016
2017
ROMANIA
2016
2017
Below 30 years
29
6
23
27
24
19
24
22
6
4
6
5
4
5
1
4
23
16
19
18
0
0
0
Between
30 and 50 years
2
11
2
2
8
1
0
6
1
0
0
0
13
5
0
5
5
2
3
1
0
Over 50 years
16
2
0
4
12
12
3
9
14
4
10
12
22
3
9
0
0
0
0
0
0
2
0
Total employees
69
47
28
41
25
0
0
Total women
50
31
14
36
23
Total men
19
16
14
8
14
5
2
0
0
0
0
20
