
Page 14 - PNMRT AnnRpt 2020
P. 14
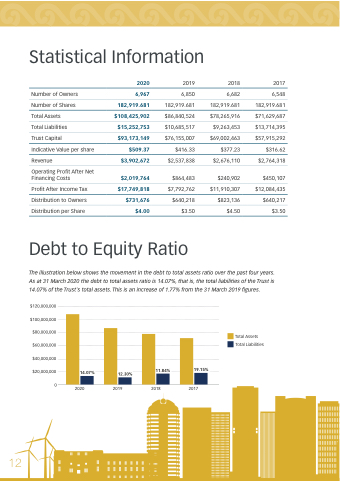
12 Statistical Information 2020 6,967 182,919.681 $108,425,902 $15,252,753 $93,173,149 $509.37 Revenue $3,902,672 2019 6,850 182,919.681 $86,840,524 $10,685,517 $76,155,007 $416.33 $2,537,838 $864,483 $7,792,762 $640,218 $3.50 2018 6,682 182,919.681 $78,265,916 $9,263,453 $69,002,463 $377.23 $2,676,110 $240,902 $11,910,307 $823,136 $4.50 2017 6,548 182,919.681 $71,629,687 $13,714,395 $57,915,292 $316.62 $2,764,318 $450,107 $12,084,435 $640,217 $3.50 Number of Owners Number of Shares Total Assets Total Liabilities Trust Capital Indicative Value per share Operating Profit After Net Financing Costs Profit After Income Tax Distribution to Owners Distribution per Share $2,019,764 $17,749,818 $731,676 $4.00 Debt to Equity Ratio The illustration below shows the movement in the debt to total assets ratio over the past four years. As at 31 March 2020 the debt to total assets ratio is 14.07%, that is, the total liabilities of the Trust is 14.07% of the Trust's total assets. This is an increase of 1.77% from the 31 March 2019 figures. $120,000,000 $100,000,000 $80,000,000 $60,000,000 $40,000,000 $20,000,000 0 Total Assets Total Liabilities 14.07% 12.30% 11.84% 19.15% 2020 2019 2018 2017
