
Page 27 - UKRRptJuly18
P. 27
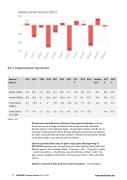
5.2.1  Import/export dynamics
External 2007 2008 2009 2010 2011 2012 2013 201 2015 2016 Jan-Nov 2017 2018 balance 4 2017 E F
Exports (US$bn) 61.4 82.5 52.1 65.6 83.7 86.5 81.7 65.4 47.6 44.9 39.4 60.2 60.8
Imports (US$bn) 69.5 96.8 54 69.6 93.8 100.9 97.4 70 49 50.3 44.5 54.6 57.2
Trade balance -8.1 -14.4 -2 -4 -10.1 -14.3 -15.6 -4.6 -1.5 -2.9 -5.2 -5.3 -6.4 (US$bn)
Trade balance -5.7 -7.8 -1.7 -2.9 -6.2 -8.2 -8.7 -3.5 -1.6 -5.8 / -4.4 -5.9 (% of GDP)
Source: ICU
Poland now rivals Russia as Ukraine’s top export destination  and tops Russia as source of wage remittances from workers abroad, Oleksandr Kramar reports in The Ukrainian Week. Through April, Ukraine sold $1.1bn in products to Poland and $1.2bn to Russia. Although personal money transfers are often undocumented, Ukrainian workers in Poland are expected to transfer home almost $4bn, more the amount from Russia.
Ukraine exported 39mn tons of grain crops since the beginning of 2017/2018  marketing year, the press service of the Agrarian Policy and Food Ministry reports. This included: wheat - 17mn tons, corn - 17.6mn tons, barley - 4.2mn tons and rye - -36,800 tons, plus 412,400 tons of flour. In 2017 the grain harvest totalled 61.28mn tons, 4.7mn tons less than in 2016, Ukrinform reports.
Ukraine’s exports to EU up 26.6% in the first quarter . “The European
27  UKRAINE Country Report  July 2018    www.intellinews.com
