
Page 32 - UKRRptJuly18
P. 32
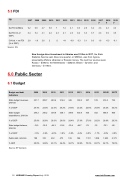
5.3  FDI
FDI
2007 2008 2009 2010 2011 2012 2013 2014 2015 2016 2017 2018 2019 FFF
Net FDI (US$bn) 9.2 9.9 4.7 5.8 7 7.2 4.1 0.3 2.9 3.4 4.3 4.3 4.3
Net FDI (% of 6.4 5.4 4.1 4.2 4.3 4.1 2.3 0.2 3.3 3.7 4.3 3.9 3.5 GDP)
C/A bal. + net FDI 2.8 -1.6 2.6 2 -2 -4.1 -6.9 -3.3 3.1 0.3 1.6 -0.3 -0.1 (% of GDP)
Source: ICU
6.0  Public Sector 6.1  Budget
New foreign direct investment in Ukraine was $1.9bn in 2017 , the State Statistics Service said. About one quarter, or $506mn, was from Cyprus, presumably offshore Ukrainian or Russian money. The next four sources were: Russia -- $396mn; the Netherlands -- $262mn; Britain -- $212mn; and Germany -- $119mn.
Budget and debt 2008 2009 2010 2011 2012 2013 2014 2015 2016E 2017F indicators
State budget revenues, 231.7 209.7 240.6 314.6 346 339.2 357 519 616.3 724 UAH bln
% of GDP 24.4% 23.0% 22.3% 24.2% 24.6% 23.2% 22.8% 26.9% 26.2% 26.3%
State budget 244.2 245.2 304.9 338.1 399.4 403.9 435 552 686.4 806 expenditures, UAH bln
% of GDP 25.8% 26.8% 28.3% 26.0% 28.4% 27.6% 27.8% 29.2% 28.9% 29.3%
State budget balance, -12.5 -35.5 -64.3 -23.6 -53.4 -64.7 -78 -33 -70.1 -82 UAH bln
% of GDP -1.3% -3.9% -6.0% -1.8% -3.8% -4.4% -5.0% -1.7% -3.0% -3.0%
Public debt, UAH bln 189 318 432 473 516 584 1,101 1,594 1,930 2,175
% GDP 20.0% 34.8% 40.1% 36.4% 36.7% 39.9% 70.3% 82.7% 82.1% 79.0%
Source: SP Advisors
32  UKRAINE Country Report  July 2018
   www.intellinews.com
