
Page 41 - RusRPTApr21
P. 41
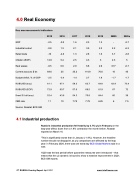
4.0 Real Economy
    Key macroeconomic indicators
          2015 2016 2017 2018 2019 2M20 2020e
                 GDP -2.5 -0.2 1.6 2.3 1.3 - -2.7
                 Industrial output -0.8 1.3 2.1 3.5 2.3 2.2 -6.3
                 Retail trade -10 -4.6 1.3 2.8 1.6 3.7 -3.8
                 Inflation (EOP) 12.9 5.4 2.5 4.3 3 2.3 5
                 Real wages -9.5 0.6 2.9 6.8 2.9 6.5* -6.7
                 Current account, $ bn 69.6 25 35.2 114.9 70.6 16 45
                 Budget deficit, % of GDP -2.5 -3.4 -1.4 2.7 1.8 -1.7 -1.7
                 RUB/USD (avg) 61.1 67.1 58.3 62.7 64.8 62.9 73.4
                 RUB/USD (EOP) 72.9 60.7 57.6 69.5 61.9 67 72
                 Brent $ / bbl (avg) 52.4 43.6 54.3 70.8 64.4 60 39
                CBR rate 11 10 7.75 7.75 6.25 6 7.5
                Source: Rosstat, BCS GM
  4.1 Industrial production
                Russia’s industrial production fell heavily by 3.7% y/y in February on the leap-year affect, down from a 1.9% contraction the month before, Rosstat reported on March 16.
“This is significantly worse than in January (-1.9%). However, the headline number should not disappoint, as y/y comparisons are affected by the leap year: in February 2020, there was one extra day BCS Global Markets said in a note.
1Q20 was the last period before quarantine measures were introduced – that means that the y/y dynamic is bound to show a massive improvement in 2Q21, BCS GM reports.
   41 RUSSIA Country Report April 2021 www.intellinews.com
