
Page 63 - Buy Russia - bne IntelliNews monthly magazine April 2017
P. 63
bne April 2017 New Europe in Numbers I 63
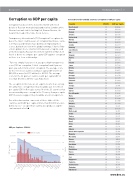
Corruption vs GDP per capita
Corruption has been in the news this month with fresh details of Russian money being laundered via London, while Ukraine has indicted its first big fish, Roman Nasirov, the head of the head of the State Fiscal Service.
Transparency International’s (TI) Corruption Perceptions In- dex is the most cited measure of corruption but how accurate is it? Russia and Ukraine have both been improving their scores, but both are low in the global rankings. Charles Rob- ertson, global chief economist of Renaissance Capital, said at the New Sparta Russian Investment Summit on March 23 that it is better to compare per capita GDP against corruption as there is a clear relationship.
“Put very simply, if you are rich, you get a high transparency score (100 no corruption, 0 total corruption) and if you are poor, you suffer from a lot of corruption. The average score for the 10 richest countries with per capita GDP in 2011 of $50,000 or more (in 2011 dollars) is 82/100. The average score for the 32 poorest countries with per capita GDP of less than $1,000 is 28/100,” says Robertson.
The exception to this rule are oil exporters, which are all sig- nificantly more corrupt than they should be just in terms of per capita GDP. In Rencap’s survey 18 of the 25 countries that are measurably more corrupt in the TI survey than per capita GDP measures suggest they should be are all oil exporters.
One other observation comes out of these table: all the countries with GDP per capita of more than $10,000 are also democracies – except if that country also produces signifi- cant amounts of oil.
Selected list of EU and CEE countries corruption vs GDP per capita
Country
CPI2016
GDP per Capita
New Zealand
90
$38,066
Finland
89
$43,492
Switzerland
86
$79,578
Netherlands
83
$45,210
Germany
81
$42,326
UK
81
$40,412
Austria
75
$44,561
Ireland
73
$65,871
Estonia
70
$17,896
Poland
62
$12,309
Slovenia
61
$21,370
Spain
58
$27,012
Latvia
57
$14,141
Czech Republic
55
$18,326
Slovakia
51
$16,648
Hungary
48
$11,903
Italy
47
$30,294
Serbia
42
$5,294
Bulgaria
41
$7,091
China
40
$8,261
GDP per Capita vs. CPI2016
Denmark Sweden Norway Canada Luxembourg Belgium
US
Japan
France
Portugal
Lithuania
Georgia
Cyprus
Malta
Croatia
Romania
Montenegro
Turkey
Brazil
India
Bosnia & Herzegovina Macedonia
Armenia
Moldova
Russia
Iran
Tajikistan
Zimbabwe
90 $53,243 88 $51,604 85 $71,497 82 $42,319 81 $105,829 77 $41,491 74 $57,294 72 $37,304 69 $38,537 62 $19,759 59 $14,899 57 $3,908 55 $23,425 55 $24,298 49 $11,858 48 $9,439 45 $6,809 41 $9,317 40 $8,587 40 $1,719 39 $4,289 37 $5,060 33 $3,596 30 $1,872 29 $8,838 29 $5,124 25 $764 22 $979
Albania
39
$4,210
GDP per Capita vs.CPI2016
CPI2016
GDP per Capita
Mongolia
38
$3,704
$120,000
$90,000
$60,000
$30,000
$0
100
75
50
25
0
Kosovo
36
#N/A
Azerbaijan
30
$3,759
Kazakhstan
29
$7,138
Ukraine
29
$2,052
Kyrgyzstan
28
$956
Turkmenistan
22
$6,694
Uzbekistan
21
$2,131
www.bne.eu
GDP per Capita
CPI2016
New Zealand Finland
Switzerland Netherlands
Germany United Kingdom
Austria Ireland
Estonia Poland
Slovenia Spain
Latvia Czech Republic
Slovakia Hungary
Italy Serbia Bulgaria
China Albania Mongolia
Kosovo Azerbaijan
Kazakhstan Ukraine
Kyrgyzstan Turkmenistan
Uzbekistan
