
Page 12 - bne IntelliNews Country Report: Belarus Dec17
P. 12
4.0 Real Economy
Belarus - Main Macro Indicators 2010 2011 2012 2013 2014 2015 2016
Annual GDP (y/y)
7.74 5.54 1.73 1.07 1.59 -3.9 -2.8
GDP (per capita) 5,819 6,306 6,722 7,722 8,040 5,949 4,989
GDP: Final consumption 119,113,500 188,572,600 318,240,600 415,127,600 523,536,700 609,580,500 666,525,000 expenditure, (local currency)
GDP: Gross fixed investment capital formation, (local currency)
67,816,700 111,791,300 187,644,400 255,101,800 260,553,400 257,630,400 225,848,000
GDP: Exports, (local currency) 87,573,200 241,080,900 431,395,500 391,236,600 445,313,100 521,573,700 591,054,000
GDP: Imports, (local currency) 110,027,300 244,287,100 406,925,000 412,355,300 450,947,700 520,614,300 591,932,000
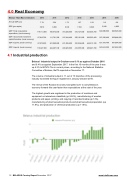
4.1 Industrial production
Belarus' industrial output in October rose 8.1% as against October 2016 and 6.4% as against September 2017. In the first 10 months of the year it was up 6.3% to BYN74.7bn in current prices, according to the National Statistics Committee of Belarus, BelTA reported on November 17.
The volume of industrial output in 11 out of 13 branches of the processing industry exceeded the figure registered in January-October 2016.
The revival of the Russian economy has spilled over to carry Belarus’s economy forward this year faster than expectations at the start of the year.
The highest growth was registered in the production of machines and equipment not elsewhere classified (up 24.6%), manufacturing of wooden products and paper, printing, and copying of recorded media (up 14%), manufacturing of pharmaceutical products and pharmaceutical preparation (up 11.8%), and production of chemical production (up 11.6%).
12 BELARUS Country Report December 2017 www.intellinews.com
