
Page 11 - GEORptMay18
P. 11
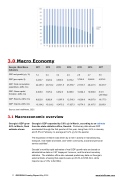
3.0   Macro Economy
Georgia - Main Macro 2011 2012 2013 2014 2015 2016 2017 Indicators
GDP real growth (y/y, %)
7.2 6.4 3.4 4.6 2.9 2.7 5.0
GDP (per capita, $) 3,230.7 3,523.4 3,599.6 3,676.2 3,766.6 3,864.6 4,078.5
GDP: Final consumption expenditure, (GEL mn)
22,487.3 23,733.2 23,671.8 25,570.7 27,318.7 28,241.5 30,381.7
GDP: Gross capital formation, (GEL mn)
6,368.0 7,575.4 6,652.9 8,688.8 10,004.3 10,999.8 8,101 (Jan-Sep)
GDP: Exports, (GEL mn)
8,822.8 9,982.9 11,997.9 12,518.3 14,206.8 14,837.8 19,177.3
GDP: Imports, (GEL mn)
13,334.2 15,124.2 15,475.2 17,627.3 19,774.3 20,187.5 23,650.1
Source: bne IntelliNews, CEIC
3.1  Macroeconomic overview
Georgia’s GDP grew 5.6% in March, flash estimate shows
Georgia’s GDP expanded by 5.6% y/y in March, according to an   estimate from the state statistics office, Geostat.  Preliminary data shows GDP accelerated through the first quarter of this year, rising from 4.4% in January and 5.5% in February, to average at 5.2% y/y for the quarter.
The expansion in March was driven by a rise in activity in manufacturing, transport, real estate and trade, and “other community, social and personal service activities”.
Geostat’s monthly rapid estimates of real GDP growth rate are based on administrative data on VAT taxpayers’ turnover, and fiscal and monetary statistics. The statistics office also released preliminary data on Georgia’s external trade, showing that exports were up 28.4% to $740.3mn, while imports rose 21.6% to $2.08bn.
11  GEORGIA Country Report  May 2018    www.intellinews.com
