
Page 21 - GEORptMar20
P. 21
5.0 External Sector & Trade
5.1 Balance of payments, current account
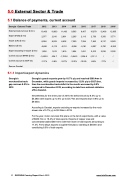
Georgia - External Trade 2012 2013 2014 2015 2016 2017 2018 2019*
External trade turnover ($ mn)
10,433 10,933 11,463 9,505 9,407 10,679 12,493 12,835
Export (FOB) ($ mn)
2,377 2,910 2,861 2,205 2,113 2,736 3,356 3,771
Import (CIF) ($ mn)
8,056 8,023 8,602 7,300 7,294 7,943 9,137 9,063
Balance ($ mn)
-5,680 -5,112 -5,741 -5,096 -5,181 -5,207 -5,781 -5,292
Export excluding re-export ($ mn)
1,606 1,812 1,819 1,604 1,621 2,010 2,226 2,352
Current account BPM6 ($ mn)
-1,853.0 -934.7 -1,763.6 -1,684.3 -1,934.9 -1,311.1 / /
Current account to GDP (%)
-11.7% -5.8% -10.7% -12.2% -12.9% -8.8% -7.7% /
Source: Geostat
5.1.1 Import/export dynamics
Georgia’s merchandise trade gap narrows 8.5% in 2019
Georgia’s goods exports grew by 18.7% y/y and reached $390.4mn in December, while goods imports increased by 12.9% y/y to $927.0mn, thus the merchandise trade deficit in the month worsened by 8.9% compared to December 2018, according to data from national statistics office Geostat.
Nevertheless,for the entire year of 2019, the deficit shrunk by 8.5% y/y to $5.28bn with exports up 12.4% y/y to $3.77bn and imports down 0.8% y/y to $9.05bn.
According to Geostat, exports excluding re-exports increased by the much slower rate of 5.7% y/y to $2.35bn in 2019.
For the year, motor cars took first place on the list of export items, with a value of $686.7mn or 18.2% of total exports. Exports of copper ores and concentrates totalled $651.6mn with their share in total exports amounting to 17.3%. Ferro-alloys exports occupied third place, standing at $303mn and constituting 8.0% of total exports.
21 GEORGIA Country Report March 2020 www.intellinews.com
