
Page 27 - UKRRptApr21
P. 27
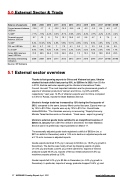
 5.0 External Sector & Trade
                 Balance of payments
2008
2009
2010
2011
2012
2013
2014
2015
2016
2017
2018E
2019E
Current account balance, USD bln
-12.8
-1.7
-3
-10.2
-14.3
-16.5
-4.6
-0.2
-3.5
-2.4
-4.5
-4.7
% GDP
-7.1%
-1.5%
-2.2%
-6.3%
-8.1%
-9.0%
-3.4%
-0.2%
-3.7%
-2.2%
-3.4%
-3.2%
Financial account balance, USD bln
9.7
-12
8
7.8
10.1
18.6
-9.1
0.6
4.7
5
7.4
4
% GDP
5.4%
-10.2%
5.9%
4.8%
5.8%
10.1%
-6.8%
0.6%
5.0%
4.5%
5.6%
2.7%
FDI net, USD bln
9.9
4.7
5.8
7
7.2
4.1
0.3
3
3.3
2.6
2.4
2.5
% of GDP
5.5%
4.0%
4.2%
4.3%
4.1%
2.2%
0.2%
3.3%
3.5%
2.3%
1.8%
1.7%
Gross NBU reserves (eop), USD bln
31.5
26.5
34.6
31.8
24.5
20.4
7.5
13.3
15.5
18.8
20.8
20.5
Monetary and banking indicators
2008
2009
2010
2011
2012
2013
2014
2015
2016
2017
2018E
2019E
                 Source: SP Advisors
5.1 External sector overview
    Thanks to fast-growing exports to China and Vietnam last year, Ukraine slashed its trade deficit last year by 93%, to $255mn in 2020, from $3.4bn in 2019, Kachka said when speaking at the Ukraine’s International Trade Council. He said: “The most important indicators are the phenomenal growth of exports of Ukrainian products to Vietnam and China - by 93% and 98%, respectively." Last year, 14.5% of Ukraine’s exports went to China, compared to 5.5% for Russia, reports the State Statistics Service.
Ukraine’s foreign trade has increased by 12% during the first quarter of 2021, compared to the same January-March period last year. Exports were up by 12% to $13.75bn. Imports were up by 12% to $15.1bn. Overall trade totalled $28.8bn. “The Ukrainian economy is recovering,” Deputy Economy Minister Taras Kachka wrote on Facebook. “Good news - export is growing.”
Ukraine’s external goods trade switched to an insignificant surplus of $26mn in January from a $817mn deficit in December, the State Statistics Service said in its preliminary report published on March 17.
The seasonally adjusted goods trade registered a deficit of $602mn (vs. a $511mn deficit in December) amid a 1.9% m/m decline in adjusted exports and a 0.1% m/m increase in adjusted imports.
Goods exports declined 5.5% y/y in January to $3.9bn (vs. 18.8% y/y growth in December). The decline was mostly driven by dropping exports of grains (-41.0% y/y) and foods (-22.0% y/y). At the same time, exports of mineral products surged 45.4% y/y, exports of ferrous metals advanced 4.5% y/y, machinery exports picked up 3.9%.
Goods imports fell 5.2% y/y to $3.9bn in December (vs. 4.8% y/y growth in December). In particular, imports of energy products dropped 16.4% y/y and
 27 UKRAINE Country Report April 2021 www.intellinews.com
