
Page 38 - RusRPTDec18
P. 38
5.0 External Sector & Trade 5.1 External sector overview
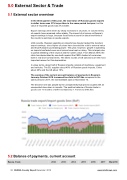
In the third quarter of this year, the total value of Russian goods exports in dollar terms was 31% larger than in the same period last year, but the value of imported goods was 2% smaller.
Export earnings were driven by sharp increases in oil prices. In volume terms, oil exports have remained rather stable. The impact of oil prices on Russia’s export earnings is huge, because fossil fuels account for about two-thirds of the country’s earnings on goods exports.
Until recently, Russian spending on imports has closely tracked the trends in export earnings, since higher oil prices have boosted the ruble’s external value and thus Russians’ purchasing power. This year, however, growth in spending on imports has faded even as oil prices have kept on rising. This is largely due to partial delinking of the oil price and the ruble’s value. From March 2018, the ruble has depreciated by one-tenth against the CBR’s basket of currencies both in real and nominal terms. The latest rounds of US sanctions are the most important reason for this depreciation.
In value terms, about half of Russian imports consists of machinery, equipment and vehicles. The EU supplies about 40% of Russian goods imports, China about 20% and the US about 10%.
The surplus of the current account balance of payments in Russia in January-October 2018 increased four-fold to $87.9bn compared to the same period in 2017, the Central Bank said on November 13.
The decisive role was played by the unexpectedly high prices coupled with an unexpected slow down in imports. The positive balance of foreign trade in goods over 10 months of 2018 increased by 1.7 times to $154.6bn.
5.2 Balance of payments, current account
Russia -Trade 2012 2013 2014 2015
2016 2017 Mar-2018
38 RUSSIA Country Report December 2018
www.intellinews.com
