
Page 66 - bne magazine trial Shauna
P. 66
66 I New Europe in Numbers bne May 2017
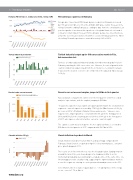
Romania FDI inflows vs. C/A balance [€mn,
FDI continues rapid rise in Romania
Romania FDI inflows vs. C/A balance [€mn, rolling 12M]
rolling 12M]
5,000
FDI inflows
FDI
inflows, 2,500 equity
2,500 5,000
C/A balance Net FDI
inflows, month
Turkey industrial production
Foreign direct investment (FDI) made by non-residents in Romania increased
by 7.7% y/y to €4.13bn, or 2.3% of the €182bn GDP projected for this year, in the rolling 12 months ending February, according to data from the central bank. Last year foreign direct investment hit a peak since the global financial crisis and it
is likely to remain robust this year. From a broader perspective, investments are at half the level they were before the 2009 recession. In February 2016 the FDI in the rolling 12 months previous accounted for nearly 2.4% of 2016.
Turkish industrial output up for fifth consecutive month in Feb, but momentum lost
Turkey’s calendar-adjusted industrial production index moved up by 1% y/y in February, marking the fifth consecutive rise. However, the rate of growth in the country’s industrial output slowed from the 2.6% y/y rise recorded in January. It was also the weakest seen since December when the adjusted index was up 1.6% y/y.
Russia’s current account surplus jumps to $23bn in first quarter
Russia’s balance of payments statistics for the first quarter of 2017 exceeded analysts’ expectations, with the surplus jumping to $22.8bn.
“In a positive sign, there was significant export growth in both the oil and non-oil segments – non-oil exports increased by 17.8% y/y (or $5bn) versus a 9.4% y/y decrease in 2016,” Alfa Bank’s Natalia Orlova said in a note. “However, on a negative note, import growth accelerated from 5.6% y/y in the third quarter of 2016 and 8.5% y/y in the fourth quarter of 2016 to 24.9% y/y in the first quarter of 2017, which poses a threat to further current account strength.”
The capital account was also negative: the net capital outflows accelerated to $15.4bn in the first quarter of 2017 compared with $16.1bn in 2016.
Slovak inflation steps back in March
Slovak inflation slowed to 1% y/y in March, a drop of 0.2pp compared with February, Slovak Statistics reported on April 13. On a monthly basis, consumer price growth dropped -0.1%.
The results are in line with others across the Visegrad region. Surging inflation around the turn of the year showed signs of a slowdown in March as the momentum provided by fuel and food prices faded a little. At the same time, core inflation appears to be steadily rising, suggesting the tightened labour markets across the region are starting to create genuine demand pressure on the CPI.
Core inflation, which excludes regulated prices – including those in the energy sector – rose to 1.7% in March.
Turkey industrial production
Industrial Production (y/y)
8.00 4.00 0.00 4.00 8.00
Russia trade: current account
Russia trade: current account
Trade: Current account BPM6 (USD mn)
30000
30000
20000
10000
22800
16638.4
14951.7
12900
7974.8
7800 400
1700
Slovakia inflation CPI y/y
Slovakia inflation CPI y/y
www.bne.eu
inflation: CPI y/y
1.0 0.5 0.0 0.5
CPI y/y % Current account $mn Industrial production change % y/y
Jan 2015 March 2015
3Q16 4Q16
May 2015 July 2015
1Q17
Sept 2015 Nov 2015
Jan 2016 March 2016
May 2016 July 2016
Sept 2016 Nov 2016
Jan 2017 Mar 2017
1Q15 2Q15
May 2016 July 2016
3Q15 4Q15
Sept 2016 Nov 2016
1Q16 2Q16
Jan 2015 March 2015
Sept 2016 Nov 2016
May 2015 July 2015
Jan 2017 Mar 2017
Sept 2015 Nov 2015
Jan 2016 March 2016
Jan 2015 March 2015
May 2015 July 2015
Sept 2015 Nov 2015
Jan 2016 March 2016
May 2016 July 2016
